US Inflation Eases in July, Reducing Likelihood of September Fed Rate Hike
Key Takeaways
- •The US annual inflation rate edged down to 3.4% in July 2026 from 3.5% in June, extending a months-long disinflation trend but still exceeding the Federal Reserve's 2% target.
- •Core CPI increased 0.2% month-over-month and 2.5% year-over-year in July, indicating that underlying price pressures apart from food and energy are gradually moderating.
- •Prediction markets assign a 50.5% probability to the Fed holding rates steady across consecutive meetings through October, signaling growing confidence that the tightening cycle has concluded.
- •The divergence between headline inflation at 3.4% and core inflation at 2.5% suggests that energy and food costs remain meaningful drivers of top-line price growth.
- •The September FOMC meeting will release an updated Dot Plot that could significantly reshape market expectations for the trajectory of future interest rate decisions.
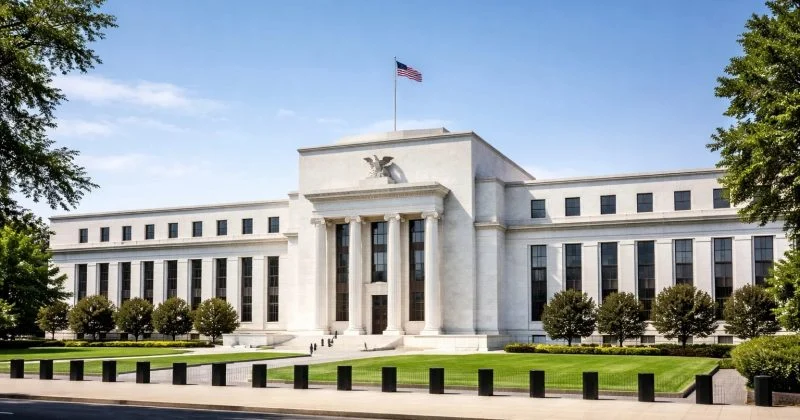
Inflation in the United States continued to moderate in July 2026, with the year-over-year rate easing to 3.4%, down slightly from 3.5% in June. While the headline figure remains above the Federal Reserve's 2% long-term target, the incremental decline marks the latest data point in a monthslong disinflation trend that has reshaped market expectations for monetary policy. The latest figures reinforce expectations that the Federal Reserve is unlikely to implement an additional rate hike at its September meeting.
The trend was highlighted on social media by @fundstrat, who pointed to the cooling inflation data as an indication that the Fed's tightening cycle may have run its course.
The core Consumer Price Index (CPI), which excludes volatile food and energy components, posted a modest 0.2% increase month-over-month in July. On an annual basis, core CPI rose 2.5%, further supporting the view that price pressures are gradually subsiding. Core CPI is closely watched by policymakers and economists because it is considered a more reliable gauge of underlying inflation trends, filtering out price swings in categories that can be driven by temporary supply disruptions or geopolitical events. The gap between headline and core annual rates — 3.4% versus 2.5% — suggests that energy and food costs continue to contribute meaningfully to top-line inflation. The Fed's long-term inflation target stands at 2%.
Market participants are increasingly pricing in scenarios in which the Federal Reserve either pauses or begins cutting interest rates in the coming months. According to current prediction-market pricing, the so-called "Pause–Pause–Pause" scenario — in which the Fed holds rates steady across consecutive meetings — is priced at 50.5% for October. The federal funds rate has remained at elevated levels since the Fed's aggressive tightening campaign that began in 2022, and the persistence of above-target inflation has been the primary argument among hawks for maintaining a restrictive stance.
What to Watch
Upcoming Federal Reserve meetings and public statements from key officials, including Chair Kevin Warsh, will be closely watched for signals about the future direction of monetary policy. The Federal Open Market Committee (FOMC) relies on a broad set of economic indicators, including inflation and labor market data, when determining the appropriate stance for the federal funds rate.
Any shifts in core inflation or employment figures could reshape expectations for the Fed's rate path. The September FOMC meeting will feature an updated Dot Plot, which summarizes individual committee members' projections for the federal funds rate over the coming years. The Dot Plot has historically served as a key market-moving release, as shifts in the median projection often trigger immediate repricing across rate-sensitive assets. Investors will be scrutinizing both the Dot Plot and any public commentary from Fed officials for indications of readiness to adjust the current policy stance, particularly if inflation continues to trend in line with the latest data.
