HYPE Price Dips to $70 Where Weekly Channel and Daily Fibonacci Support Converge
Key Takeaways
- •HYPE is trading near $70, where the lower rail of its weekly rising channel and the daily chart's 0.618 Fibonacci retracement sit within a few cents of each other.
- •The daily decline from the October peak near $100 has already taken out Fibonacci retracements at roughly $88, $81, and $75, leaving $70 as the last defined level before references near $61 and $51.
- •The weekly RSI has dropped to 49.42, its first reading below the 50 midpoint since the first quarter, while the daily RSI at 32.79 stands close to oversold territory.
- •Tonight's daily close and Sunday's weekly close near $70 will determine whether the trend since January stays intact or records its first channel-floor failure in ten months.
- •Broader market weakness, with Bitcoin near $67,000 and Ethereum around $1,850 and both still declining, means the HYPE support cluster must absorb selling pressure from the entire market rather than a single-coin correction.
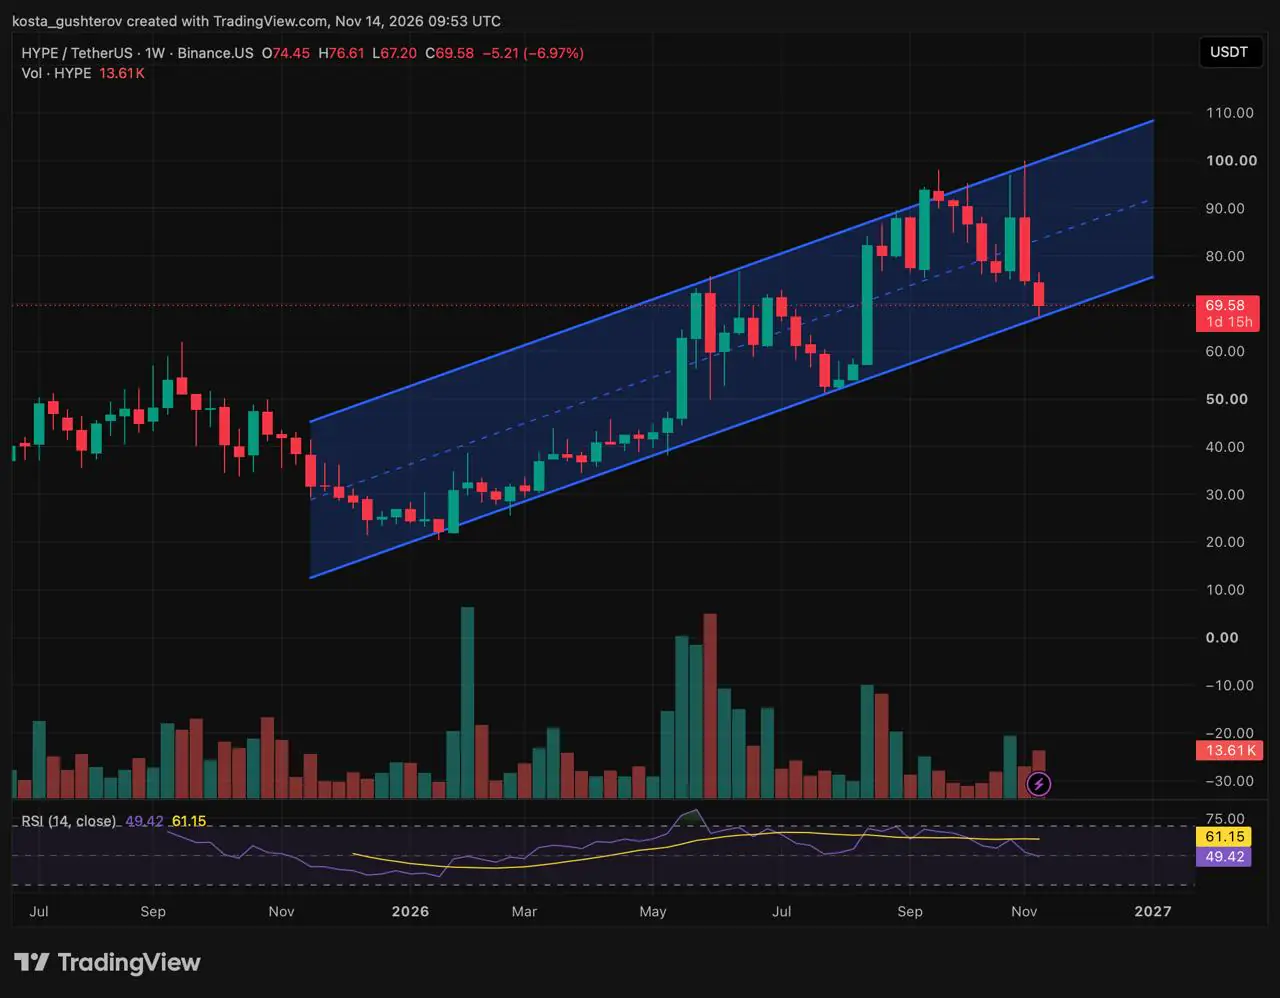
HYPE — the native token of Hyperliquid, a decentralized exchange for perpetual futures — is trading near $70 on Saturday, at a level where two independent technical references converge: the lower boundary of a rising parallel channel on the weekly chart and the 0.618 Fibonacci retracement on the daily chart. The weekly timeframe frames the move as a pullback within an uptrend that has run since January, while the daily timeframe shows a steep two-week correction that has already claimed three Fibonacci levels. Both perspectives have delivered price to the same number, which is why the next two closes carry more weight than the previous ten.
Weekly Chart: Back at the Rail That Defined the Trend
HYPE bottomed near $22 in January 2026 and has traded inside a rising parallel channel on the Binance.US weekly chart ever since. The lower rail has served as the trend's engine: price rode it from January through May, returned to it during the mid-July pullback near $52, and launched higher again. On the upside, the upper rail — together with the $100 handle — turned price away in September and once more in early November.
This week's candle marks the first return to the lower rail since July. It opened at $74, reached $77, and printed a low of $67 that briefly poked through the trendline before recovering to $70, where the body is resting on the line with a day and fifteen hours left before Sunday's close.
The weekly RSI (14), a momentum indicator, has come down from above 75 in May and June to 49.42, below its signal line at 61.15 and beneath the 50 midpoint for the first time since the first quarter. On this timeframe, the uptrend is intact and being tested, not broken.
Daily Chart: Three Levels Lost, One Remaining
Measured from the $51 August low to the $100 October peak, the daily Fibonacci grid gives the correction a defined sequence. Fibonacci retracements are a standard charting method that projects levels at fixed fractions of a prior swing; the 0.618, tied to the golden ratio, is among the most closely watched. The 0.236 near $88 gave way in the early-November breakdown. The 0.382 near $81 was the level price pivoted around in late October before the final push to $100. The 0.5 near $75 broke this week.
That leaves the 0.618 near $70, and today's candle — after opening at $72 and dipping to $67 — is trading directly on it. The decline from the early-November lower high near $97 has unfolded inside a tight descending channel, and the current candle is pressing against that channel's upper trendline at the same time it holds the 0.618.
The daily RSI stands at 32.79, below its 42.20 average and a few points above the oversold line. Trading volume on this venue is thin: the daily bar recorded 1.13K HYPE and the weekly bar 13.61K. Because Binance.US is a small pool for this pair, the price levels transfer to the wider market, while the volume figures should be read as local.
Where the Lines Cross
Three technical references sit within a few cents of $70: the lower boundary of the weekly rising channel, the daily 0.618 retracement, and the upper trendline of the daily descending channel. Buyers have already defended the area once, leaving a lower wick to $67 on both timeframes.
The daily RSI leaves sellers little room before an oversold reading, while the weekly RSI has reset from overbought to neutral. That combination forms as dense a support cluster as this chart has produced in 2026, and it is also the first place where losing a level would change the shape of the year-long trend rather than just the shape of November.
The Next Forty Hours, Close by Close
Tonight's daily close is the first checkpoint, and it poses a single question: does HYPE finish above the 0.618 near $70 or below it? A finish above would mean the candle has defended the retracement, and the lower wick to $67 would stand as a rejection. The stronger version of that outcome is a close back above today's open at $72, because that is where the upper trendline of the descending channel runs; a close there would take price out of the channel and end the daily downtrend as a structure. A close below $70 would mean the last Fibonacci level of the grid has gone the way of the three above it.
Sunday's weekly close is the second checkpoint, and the one that reaches further back. The rising channel has caught every weekly close since January, so a finish at or above the rail near $70 keeps the trend's definition unchanged, whatever the daily chart did on Saturday. A weekly close under $70 is different in kind: it would be the first time in ten months that the trend's own boundary failed to hold, and it would land with the weekly RSI already under 50 for the first time since the first quarter.
Combining the two outcomes yields only a few possibilities. A daily close above $72 together with a weekly close above $70 is the cleanest recovery case, and the path it opens runs back up the grid: the 0.5 near $75, then the 0.382 near $81, then the weekly channel midline around $85 to $88 as the first higher-timeframe level a rebound would have to earn.
A daily close above $70 with a weekly close below it is a split verdict — a bounce on the short chart that has not repaired the long one. Closes under $70 on both timeframes constitute the breakdown case: a close beneath the $67 swing low would confirm the loss of the channel floor and the 0.618 together, and the daily grid's remaining references below are the 0.786 around $61 and the $51 origin of the August rally.
The Broader Backdrop
Market conditions do not favor the recovery combination. Bitcoin is near $67,000 and Ethereum around $1,850, both still falling, meaning a support cluster that would normally absorb a single-coin correction must instead absorb the whole market's selling at once. Even on the recovery path, a bounce that stalls under the 0.5 near $75 leaves the daily channel in place and the weekly test unanswered.
None of this constitutes a forecast. It is a reading of which close answers which question, and until Sunday night, both the weekly chart's verdict and the daily chart's verdict remain pending.
This article is for informational purposes only and is not financial or investment advice. The levels and scenarios described are based on technical analysis of public chart data and do not guarantee future price movements. Cryptocurrencies are volatile, so do your own research before making any trading or investment decision.
Source: Coindoo

