US Employment Grows Across BLS and ADP Measures, Econbrowser Business Cycle Indicators Show
Key Takeaways
- •Employment expanded across every major measure tracked by the NBER Business Cycle Dating Committee in Econbrowser's monthly indicator update released on November 6, 2026.
- •The BLS establishment survey, the BLS household survey, and ADP's private payroll estimate are all now rising, reversing weakness from the first half of 2026, although employment is growing more slowly than output.
- •Because the three employment series are compiled independently from separate data sources, their agreement serves as a cross-check confirming the labor market's upward direction.
- •Despite the employment gains, consumption and retail sales were flat in September while personal income fell, and real personal income excluding current transfers is one of the committee's core series.
- •The October 2026 inflation-adjusted average hourly earnings figure is based on a CPI nowcast and will be finalized once official Consumer Price Index data are released.
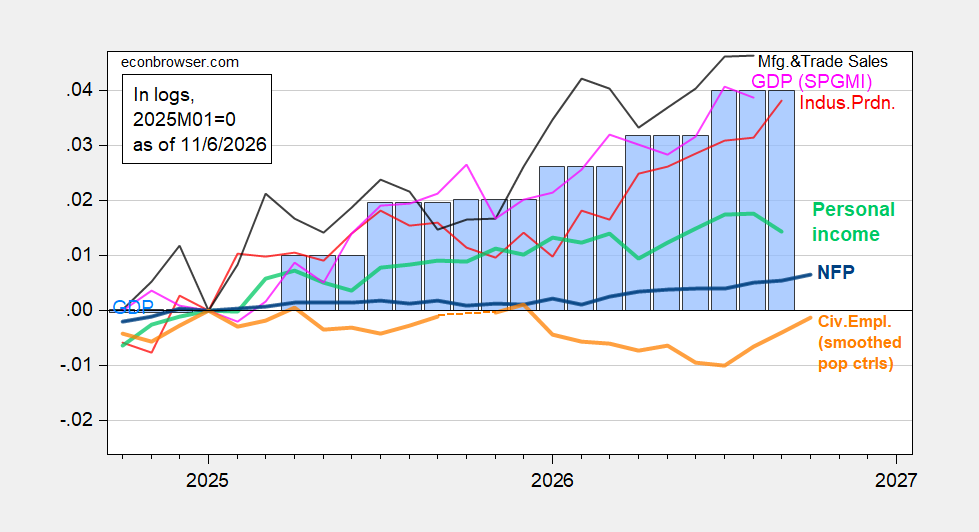
Employment expanded across every major measure tracked by the National Bureau of Economic Research (NBER) Business Cycle Dating Committee in the latest update of Econbrowser's monthly business cycle indicator series, published November 6, 2026.
The tracker compiles the key series followed by the NBER committee — the academic body that formally dates US business cycle peaks and troughs — alongside alternative indicators. The core series include nonfarm payroll (NFP) employment, civilian employment, industrial production, real personal income excluding current transfers, real manufacturing and trade sales, and monthly GDP, all expressed in chained 2017 dollars (Ch.2017$) and log-normalized to January 2025 (2025M01=0). The shared baseline allows cumulative growth since the start of 2025 to be compared directly across series that are otherwise measured on very different scales.
Figure 1: NFP employment (bold blue), civilian employment with smoothed population controls (bold orange), industrial production (red), personal income excluding current transfers in Ch.2017$ (bold light green), manufacturing and trade sales in Ch.2017$ (black), and monthly GDP in Ch.2017$ (pink), GDP (blue bars), all log normalized to 2025M01=0. Source: BLS via FRED, BLS, Federal Reserve, BEA 2026Q3 advance release, S&P Global Market Insights (nee Macroeconomic Advisers, IHS Markit) (10/2/2026 release), and author's calculations.
Figure 2: Civilian employment adjusted to NFP concept smoothed population controls, using experimental controls for 2025 (bold orange), manufacturing production (red), ADP private nonfarm payroll employment (light green), real retail sales, CPI deflated (black), freight services indexes (brown), and coincident index in Ch.2017$ (pink), GDO (blue bars), all log normalized to 2025M01=0. Source: BLS, ADP via FRED, Philadelphia Fed, Philadelphia Fed, Bureau of Transportation Statistics, Federal Reserve via FRED, BEA 2026Q3 advance release, and author's calculations.
According to the analysis, all measures of employment — the BLS Current Employment Statistics (CES) establishment survey, the BLS Current Population Survey (CPS) household survey, and ADP's private nonfarm payroll estimate — are now rising, in contrast to the first half of 2026, although not at the pace of output. The three measures are built independently: the establishment survey counts payroll jobs reported by businesses, the household survey counts employed individuals, and ADP compiles its estimate from its own payroll processing records, so agreement across all three serves as an independent cross-check on the labor market's direction. However, consumption and retail sales were flat in September, while personal income fell. Because real personal income excluding current transfers is among the committee's core series, those income and spending readings feed directly into the same dashboard, and subsequent monthly updates of the tracker will show whether employment strength extends to household income and spending.
A supplementary panel of labor market indicators charts the aggregate weekly hours index against average hourly earnings deflated to 1982-84 dollars. The October 2026 average hourly earnings observation is based on a CPI nowcast, an estimate of current inflation produced ahead of official Consumer Price Index releases; official CPI figures published later will supersede the estimate and finalize that inflation-adjusted reading.
Figure 3: Aggregate weekly hours index (blue, left log scale), average hourly earnings in 1982-84$ (red, right scale). October 2026 average hourly earnings observation is based on CPI nowcast. Source: BLS, Cleveland Fed, and author's calculations.
The full set of charts and accompanying commentary is available at Econbrowser.

