Solana Tests $73 Support as Analysts Watch $77 Breakout Level
Key Takeaways
- •Solana was recently trading near $73.90, just above the closely watched $73 support area.
- •Analysts say a loss of $73 could shift focus to $71 and then the $68.22-$64.46 support zone.
- •A move above $77 would put SOL above a descending resistance trendline and could bring $80 and $84 into focus.
- •Crypto Patel’s weekly analysis says SOL must remain within the $52-$73 area to preserve its long-term bullish structure.
- •Longer-term targets of $500 and $1,000 depend on Solana breaking multiple resistance levels, including $101 and the $180-$295 zone.
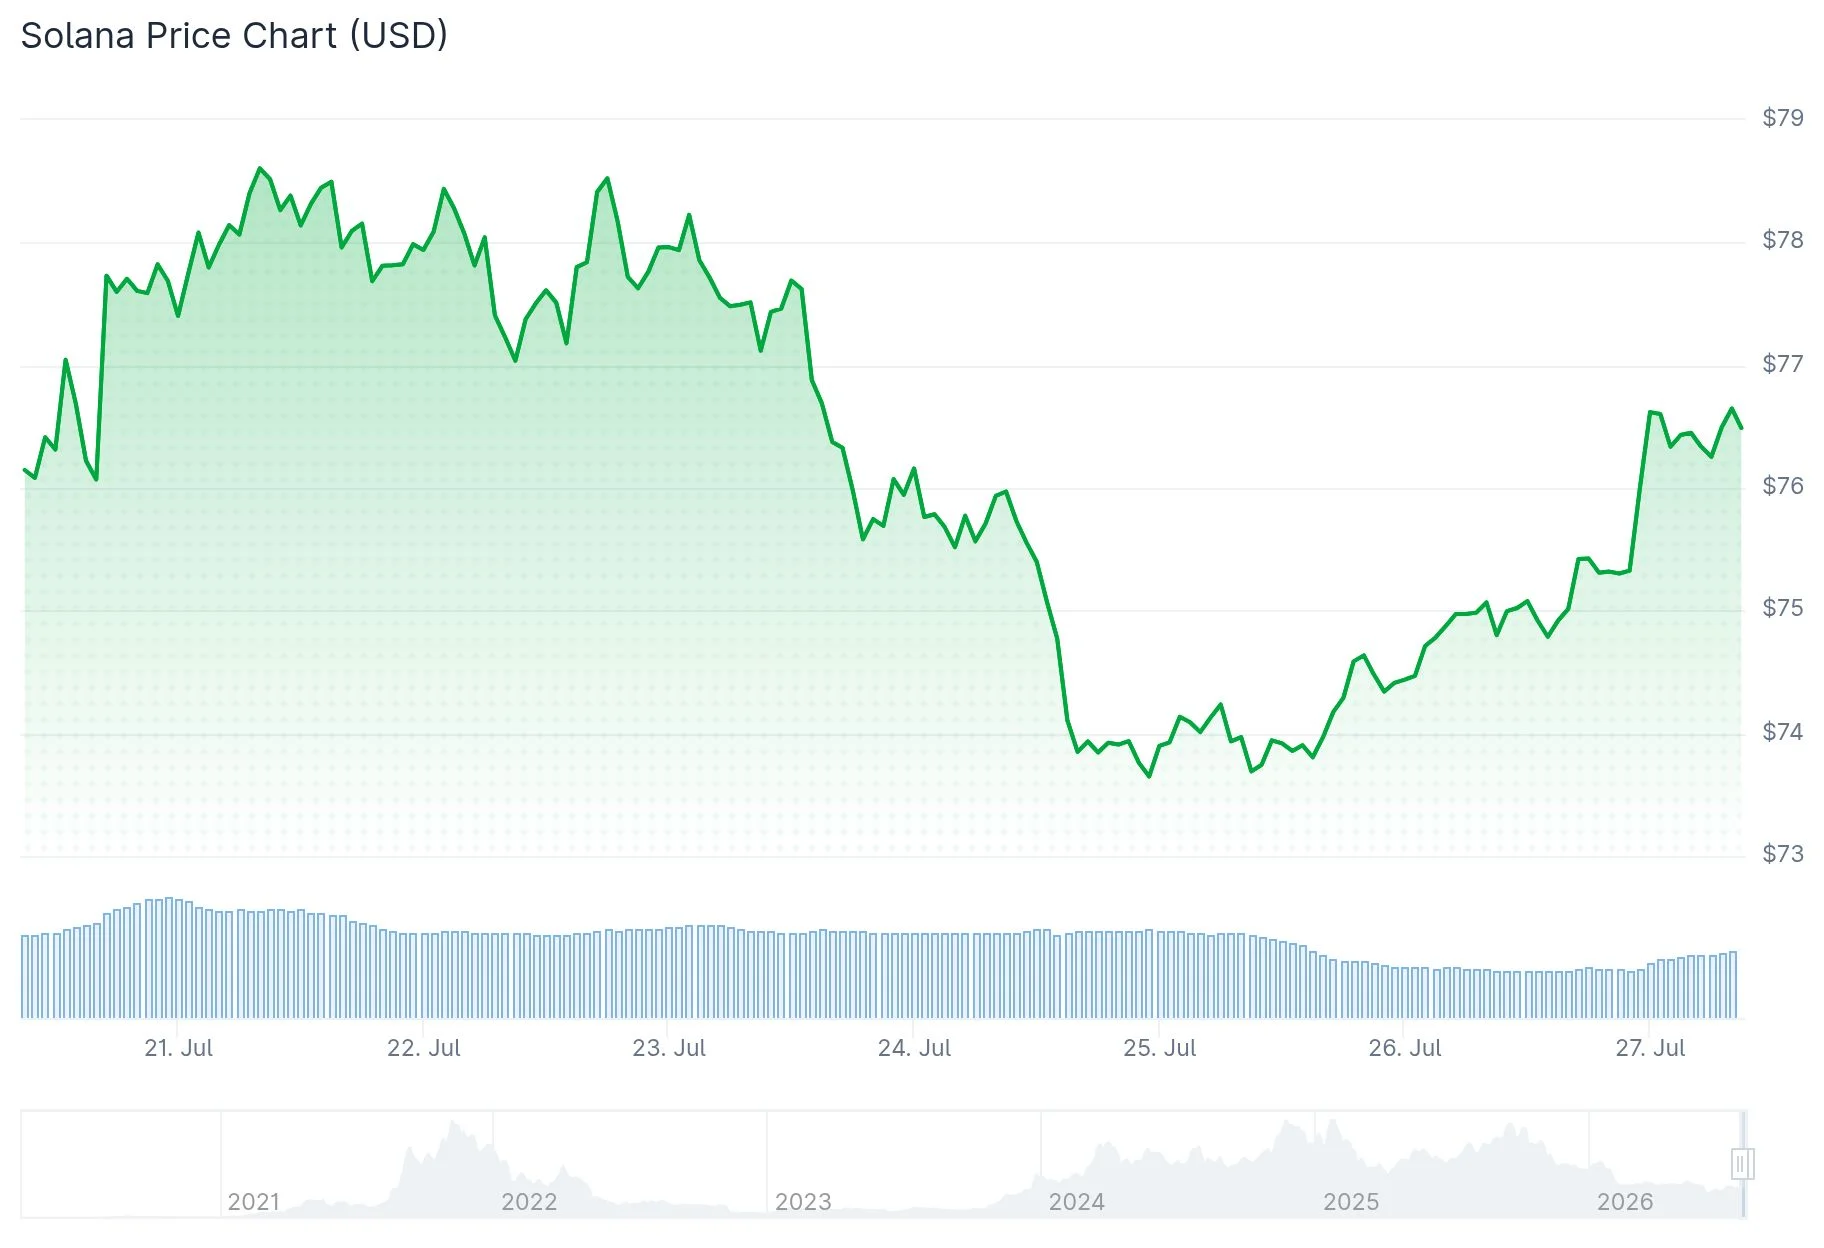
Solana (SOL) is trading near a closely watched support area around $73, placing the token at a technical decision point as analysts monitor whether buyers can defend levels that have held during the recent recovery.
The cryptocurrency was recently trading around $73.90, just above the 0.382 Fibonacci retracement level at $73.89. At the same time, SOL is testing an ascending trendline that has acted as support since June. Fibonacci retracement levels and trendlines are commonly used by technical analysts to identify areas where price reactions may occur, but they do not guarantee a specific outcome.
Crypto analyst Crypto Patel has identified the $73 area as a pivotal level for Solana’s market structure. According to his analysis, holding above $73 would preserve the bullish structure, while a breakdown could push SOL toward the $68-$64 liquidity zone.
During the recent recovery phase, buyers have defended the upward-sloping trendline several times. That repeated defense adds technical significance to the current support area, although Solana still faces several resistance levels before any sustained move higher can develop.
$SOL looks ready.
Needs to hold $75.06 into the daily/weekly close. Do that, and we have a clean deviation.
Given the look and early break on $SOL / $BTC , I wouldn't be surprised to see SOL run back to $84, possibly the $90 imbalance from May. pic.twitter.com/gqFqj4rN1P
— Justin Bennett (@JustinBennettFX) July 26, 2026
SOL remains constrained by a descending resistance trendline that begins from the July high near $84. That downward-sloping resistance continues to limit short-term recovery attempts, making the next daily and weekly closes important reference points for analysts tracking whether the current support test becomes a rebound or a deeper pullback.
Why analysts are watching $77
A move back above $77 would be a notable technical development because it would place Solana above the descending resistance trendline. If SOL clears that area, the next levels highlighted by analysts are $80 and then $84.
If the $73 support level fails, the next area of focus would be the 0.5 Fibonacci retracement near $71. Further weakness would expose the $68.22-$64.46 support zone. A decisive break below $64.46 could open the way for a retest of the June low near $60.
Crypto Patel has also published a weekly chart analysis with a broader view of Solana’s structure. On that timeframe, SOL is near $74, slightly above Fibonacci support around $72.55, while a wider support zone extends down to roughly $52. The weekly view matters because it filters out some shorter-term price noise and is often used to assess whether a broader market structure remains intact.
$SOL Is Sitting At The Most Important Level Of This Cycle #SOL is trading inside a high-confluence HTF demand zone where the previous breakout base, weekly support, and the 0.618 Fibonacci retracement all intersect.
This is the market's decision point. Hold $73 → Bullish… pic.twitter.com/3yJsuPBj1B
— Crypto Patel (@CryptoPatel) July 25, 2026
According to that analysis, maintaining price action within the $52-$73 range would preserve the long-term bullish structure. A sustained move below $52, however, could potentially drag prices toward $32.50.
Longer-term targets depend on multiple resistance breaks
On the weekly timeframe, Crypto Patel outlined potential long-term price targets of $500 and $1,000 if SOL completes a full breakout sequence.
The first major resistance level identified in that path is $101. Beyond that, Solana would face a broader resistance zone between $180 and $295, an area that includes levels around its previous all-time high.
Only a confirmed breakout above that resistance zone would make the $500 target realistic under the analysis. The $1,000 projection would imply a gain of approximately 1,900% from the lower boundary of the support zone.
Those targets depend on Solana repeating a historical breakout-and-retest pattern. At the current price near $73-$74, the analysis places SOL in an accumulation and support phase rather than an expansion phase.
The latest market data cited in the analysis shows Solana trading near $73.90, with the immediate focus on whether buyers can continue to defend the $73 level while selling pressure remains in place.

