Bitcoin Reclaims $65,000 as Fed, BOJ, Oil and Tech Earnings Shape the Week
Key Takeaways
- •Bitcoin’s rebound followed Iran’s signal that it would withhold retaliatory attacks if the United States did the same, easing near-term energy-market pressure.
- •Crude oil remains elevated despite WTI’s roughly 5% decline, with Strait of Hormuz vessel traffic down sharply in the week to July 20.
- •The Federal Reserve is widely expected to hold rates at 3.5% to 3.75%, but markets see roughly a one-in-three chance of a hike this week.
- •Bitcoin faces important resistance near $67,370, with further tests around the 100-day moving average near $69,500 and the $70,300 to $72,000 zone.
- •Stablecoin inflows linked to U.S. investors suggest capital is available on exchanges, though the article says this does not prove buying has already occurred.
Bitcoin moved back above $65,000 after a pause in hostilities eased some immediate pressure in energy markets, but several macroeconomic and market events this week could determine whether the recovery extends or stalls.
According to Reuters, Iran signaled that it would continue to withhold retaliatory attacks as long as the United States did the same. West Texas Intermediate crude fell about 5%, reducing part of the inflation pressure created by the conflict.
Even after that decline, crude remains elevated after topping $100 a barrel last week. The shipping disruption that helped drive the rally has not been resolved, leaving energy prices high enough to remain relevant for inflation and central-bank policy.
The importance of this week is the concentration of potential catalysts. Bitcoin is entering the Fed decision, Bank of Japan meeting, major technology earnings and unresolved oil-market stress while trading close to technical resistance, leaving less room for any single event to be viewed in isolation.
Bitcoin Faces a Key Test Near $67,370
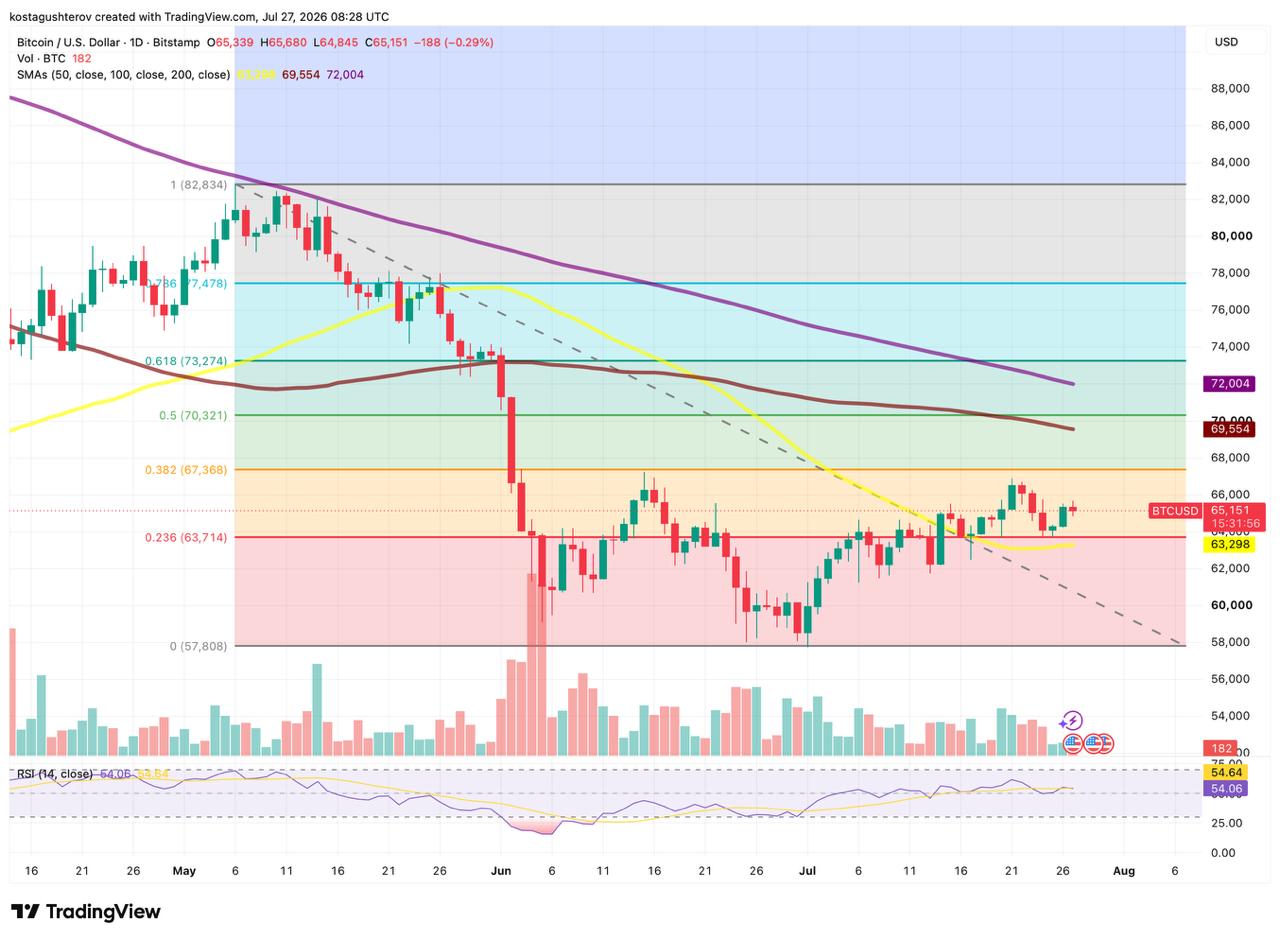
Bitcoin continues to hold above the 0.236 Fibonacci retracement level near $63,700 and the 50-day simple moving average around $63,300, based on the supplied BTC/USD Bitstamp chart dated July 27, 2026. Fibonacci retracements identify levels where a prior move often pauses, while moving averages show the average price paid over a set number of sessions. These levels can become self-reinforcing when enough traders monitor and act on them.
The area around $63,700 and $63,300 absorbed the latest pullback and kept intact the recovery from the June low. The nearest hurdle is the July 27 high near $65,680. A move above that level could extend the rebound, although the more important resistance sits at the 0.382 Fibonacci retracement near $67,370.
A daily close above $67,370 would create room toward the 100-day simple moving average near $69,500. That average is still declining, making it a key test of whether Bitcoin is shifting its medium-term structure or only rebounding within it.
The next resistance area is formed by the 0.5 Fibonacci retracement near $70,300 and the 200-day simple moving average around $72,000. The relative strength index stood near 54, showing mildly positive momentum without an overbought reading. That leaves room for further upside, although momentum alone does not confirm a breakout.
Oil Risk Has Not Disappeared
Energy is one of the largest components feeding into headline inflation, and headline inflation is a central focus for monetary policymakers. For Bitcoin, crude prices matter primarily through their effect on inflation expectations, bond yields and central-bank decisions.
CNBC, citing Lloyd’s List Intelligence data, reported that 53 vessels transited the Strait of Hormuz in the week to July 20, down 66% from 157 a week earlier. Crossings by tankers and gas carriers, which transport most Gulf crude and liquefied natural gas, fell to 30 from 90.
Roughly one-fifth of the world’s oil normally moves through the Strait of Hormuz. The traffic that continues to pass through the waterway is moving in narrow windows when operators judge the risk to be acceptable.
Renewed strikes or an attack on energy infrastructure could quickly push oil prices back above $100, raising yields and reversing some of the conditions that helped Bitcoin recover $65,000.
The Federal Reserve Decision Remains a Risk
Bitcoin does not produce income, so changes in safe-asset yields can affect its relative appeal. Higher Treasury yields increase the opportunity cost of holding Bitcoin, while a stronger U.S. dollar means each dollar of incoming demand buys less.
The Federal Open Market Committee is scheduled to meet on July 28 and 29, according to the Federal Reserve calendar, with its statement and press conference set for Wednesday. Economists broadly expect the benchmark rate to remain at 3.5% to 3.75% for a fifth consecutive meeting.
The risk lies in the possibility of tighter policy. CBS News reported that nearly half of policymakers indicated at the June meeting that they would support a rate increase later this year, while markets now assign roughly a one-in-three probability to a hike this week. Nine of 18 participants projected at least one increase before year-end, compared with eight who projected no change and one who projected a cut. The median year-end rate projection rose to 3.8% from 3.4%.
Chair Kevin Warsh has moved the Fed away from explicit forward guidance and declined to submit his own projections in June, removing a signal investors typically use before a rate decision. There is also no dot plot at this meeting.
That makes the wording of the statement and press conference especially important. Without a fresh dot plot, investors have fewer scheduled signals to separate a one-meeting hold from a broader tolerance for higher rates later in the year.
For Bitcoin, the risk is asymmetrical. A hold is largely priced in and would likely produce a limited reaction. A hike, or a hold accompanied by language that keeps a September move active, would push yields higher in a market not fully positioned for that outcome.
During the 2022 to 2023 tightening cycle, Bitcoin’s sharpest declines tracked policy surprises more closely than the hikes themselves, according to Coindoo. The worst moves followed a shift in expectations from 50 to 75 basis points in the week before the June 2022 decision. Expectations for this meeting have changed on a similar timescale, with the probability of a hike roughly doubling over 11 days in mid-July.
Bank of Japan Policy Adds Yen Carry-Trade Risk
Near-zero Japanese interest rates made the yen the cheapest major currency to borrow for two decades, helping fund leveraged positions across global markets. As the Bank of Japan raises rates, that funding becomes more expensive and positions financed with borrowed yen can be reduced or closed.
The Bank of Japan is scheduled to meet on July 30 and 31, two days after the Fed, according to its official calendar. A hawkish message could strengthen the yen and make yen-funded investments less attractive, prompting investors to sell liquid assets across several markets.
Bitcoin does not need to be purchased directly with borrowed yen to be affected. Crypto markets trade continuously and can become an early source of liquidity when leveraged portfolios are cut back.
Balanced Bank of Japan guidance paired with no rate change would keep that pressure contained. A surprise increase, or a clear signal that the next hike is approaching, could move the yen sharply and increase crypto volatility. A hawkish Fed followed by a hawkish BOJ would tighten financial conditions from both directions within three days.
Technology Earnings Will Test Broader Risk Appetite
Bitcoin has traded through much of this cycle as a higher-beta version of the Nasdaq, often moving in the same direction but with larger swings. Many institutions hold both technology equities and crypto assets, so a technology sell-off that reduces risk budgets can quickly reach crypto positions.
Microsoft reports results on July 29, alongside Meta. Amazon and Apple follow on July 30.
Strong cloud growth, advertising demand or guidance on artificial-intelligence returns could support equities and help Bitcoin maintain its recovery. Weak forecasts or concerns about excessive AI spending could have the opposite effect.
The timing may make it difficult to separate individual drivers. Microsoft and Meta report on the same day as the Fed decision, while Amazon and Apple release results shortly before the Bank of Japan decision.
Stablecoin Inflows Point to Available Capital
According to CryptoQuant, stablecoins associated with U.S. investors are moving back onto exchanges.
Stablecoins held on an exchange can be deployed immediately, so rising inflows increase the amount of capital positioned to buy without proving that any buying has already occurred. CryptoQuant’s official metric guide says inflows to spot exchanges may represent potential buying pressure.
Deposits sent to derivatives venues can instead support either long or short positions and may increase volatility. Rising spot volume alongside a daily close through resistance would show that capital being deployed. Growing balances while price stalls below resistance would show the same money waiting on the sidelines.
What Would Confirm the Recovery
Bitcoin’s rebound would gain credibility if the pause in hostilities holds, Strait of Hormuz traffic recovers enough to push crude prices lower, and the Fed avoids signaling a September rate move. Strong technology earnings and spot buying supported by stablecoin balances would add further support.
On the chart, the first confirmation would be a daily close above $67,370. The 100-day simple moving average near $69,500 carries greater weight as a medium-term test.
The setup would weaken if Bitcoin loses the support cluster it defended last week. That would expose the recent trading area around $62,000, followed by the June low near $57,800.
Bitcoin reclaimed $65,000 after a pause in hostilities that could reverse quickly. This week will show whether that move is enough to push the price through resistance, or whether hawkish central banks and a disrupted shipping lane return pressure to the market.
Disclaimer: This article is for informational and analytical purposes only and does not constitute financial or investment advice. Geopolitical events, central-bank decisions and corporate earnings can cause sudden volatility, while technical levels and on-chain data cannot guarantee future performance.
Methodology: Bitcoin levels are based on the supplied BTC/USD Bitstamp chart dated July 27, 2026. Geopolitical and oil-market information comes from Reuters and CNBC, citing Lloyd’s List Intelligence shipping data. Federal Reserve expectations and June projection figures are from CBS News and the Federal Reserve. Meeting dates are sourced from the Federal Reserve and Bank of Japan, earnings dates from official company investor-relations pages, and stablecoin interpretation from CryptoQuant.

