Ethereum Faces Converging Resistance Near $1,900 as Bears Maintain Control of Daily Trend
Key Takeaways
- •Ethereum faces overlapping technical resistance near $1,900 from a descending trendline, the Ichimoku cloud, and Fibonacci retracement levels, causing its June recovery to stall.
- •Analyst Michaël van de Poppe maintains a projected target zone between $2,500 and $2,620 for ETH, provided the cryptocurrency holds its primary support at $1,825.
- •A wallet linked to the Drift Protocol exploiter deposited 23,095 ETH valued at approximately $44.4 million into Tornado Cash, while still holding roughly 107,165 ETH worth about $201 million.
- •ETH must clear $1,927 and then $2,227 to weaken the broader bearish structure, while failure at current resistance could expose support levels at $1,550 and subsequently $1,390.
- •The daily RSI is testing an ascending support line originating from the June low, and losing it could signal weakening momentum and increase the risk of another decline.
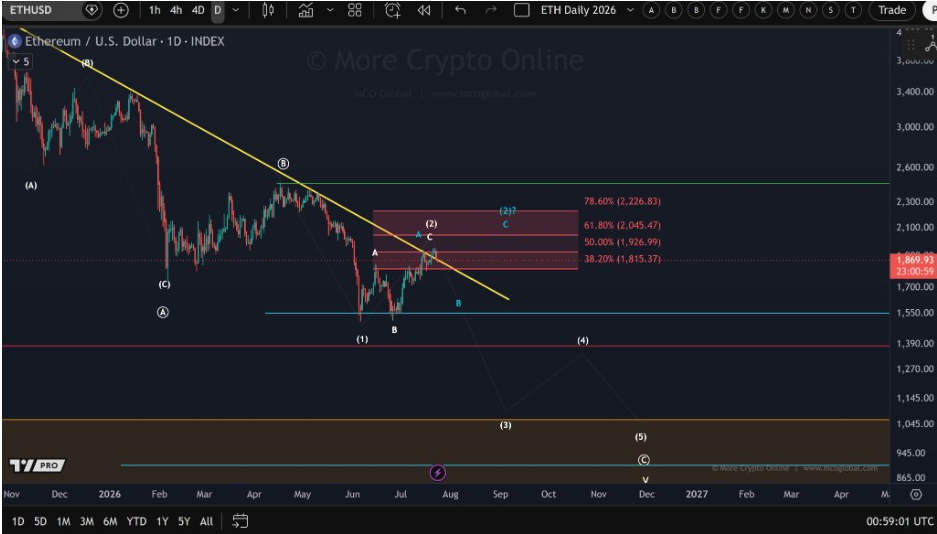
Ethereum is struggling to extend its June recovery after encountering a cluster of technical resistance levels near $1,900. Daily charts show ETH trading around $1,870, where a major downtrend line, the Ichimoku cloud, and a Fibonacci resistance band now overlap, leaving the market caught between a developing recovery and a broader bearish structure.
For buyers, the immediate priorities are holding the $1,825 support area and reclaiming $1,927. A deeper rejection, however, could shift focus back to $1,550 and $1,390. Large wallet movements are adding another layer of pressure as traders await a clearer directional breakout.
Ethereum Meets Heavy Technical Resistance
Ethereum has completed a three-wave recovery from the June low near $1,500. More Crypto Online highlighted that the rebound has reached the key third-quarter resistance zone, with the first Fibonacci level at $1,815 already under pressure.
The next Fibonacci levels sit at $1,927, $2,045, and $2,227. ETH remains below the upper boundary of this zone, meaning the broader bearish count stays valid. A sustained move above $2,227 would weaken that outlook and open room toward the April high near $2,450. Conversely, rejection from the current area could restart the larger decline, with chart support placed near $1,550, followed by $1,390.
The overlap matters because traders often treat resistance confluence as more significant than a single chart level. When trendlines, Fibonacci retracements, and cloud resistance cluster in the same area, breakouts typically need stronger follow-through to confirm that buyers have absorbed nearby supply.
Daily Cloud Rejection Keeps Sellers Active
Crypto trader Chris noted that ETH rejected the daily cloud and slipped back under the major descending trendline. The price tested both barriers near $1,900 before closing around $1,868.
The daily RSI is also testing an ascending support line that originated at the June low. Holding that line would preserve improving momentum even as price struggles beneath resistance. Losing it could push the RSI back into weaker territory and raise the risk of another cloud test. The RSI is a momentum gauge rather than a price level, so traders are watching whether momentum confirms or undermines the recovery attempt.
For buyers, the immediate task is reclaiming the trendline and holding above $1,900, which would bring $1,927 into focus and improve the probability of a move toward $2,045. Until then, the rejection keeps the short-term picture cautious and leaves sellers in control of the main daily trend.
Analyst Maintains $2,500 Target on Key Support
Michaël van de Poppe still expects Ethereum to reach the $2,500 area despite the current correction. His daily chart identified $1,825 as the primary support line, with a demand zone extending slightly below it.
ETH has moved above its short-term moving averages after forming a base near $1,500. The recovery also produced higher lows through July, suggesting buyers are attempting to establish a new market structure. Holding $1,825 would keep that sequence intact and protect the latest breakout attempt.
The projected target zone begins near $2,500 and extends toward $2,620. Before reaching it, ETH must clear $1,927 and $2,045, then challenge the wider resistance around $2,227. A loss of $1,825 would instead expose $1,700 and the $1,505 base.
Drift-Linked Wallet Transfers Add Supply Uncertainty
Lookonchain reported that the wallet linked to the Drift Protocol exploiter deposited 23,095 ETH into Tornado Cash, valued at nearly $44.4 million. The transfer introduces another source of uncertainty while ETH trades below major resistance.
Tornado Cash is a crypto mixer that can make fund flows harder to trace, which is why large deposits into the protocol often draw attention from on-chain analysts. Such movements do not by themselves show whether ETH will be sold, but they can reduce visibility into where the coins move next.
The same wallet still holds roughly 107,165 ETH, worth about $201 million, according to shared Arkham data. While that balance is large enough to attract market attention, wallet holdings alone do not confirm an intention to sell or indicate immediate exchange-bound supply. Nevertheless, fresh transfers can weigh on sentiment during a fragile recovery.
ETH now needs to defend $1,825 and push through $1,927 to reduce that pressure. A break above $2,227 would improve the broader setup, while failure at resistance keeps $1,550 and $1,390 in play.

