Shiba Inu Surges 18% on Record Volume — Can the Gains Hold?
Key Takeaways
- •Shiba Inu rallied nearly 24% intraday to $0.00000518 before settling at approximately $0.0000049, an 18% gain for the session, on the highest Coinbase volume since January at roughly 538.4 billion SHIB.
- •The price broke above its recent descending trendline and reclaimed the 50-day SMA but was rejected at the 100-day SMA, leaving SHIB still within a longer-term downtrend.
- •Reported token burns of approximately 226.6 million SHIB and a single whale wallet holding around 50.25 billion SHIB were too small in scale to independently explain the broader rally.
- •The 14-day RSI rose to approximately 71, indicating overbought conditions and suggesting the possibility of consolidation or a pullback before further gains.
- •The 50-day SMA near $0.0000044 now serves as key short-term support, while a daily close above the 100-day SMA near $0.00000519 would be needed to confirm a move toward $0.0000054.
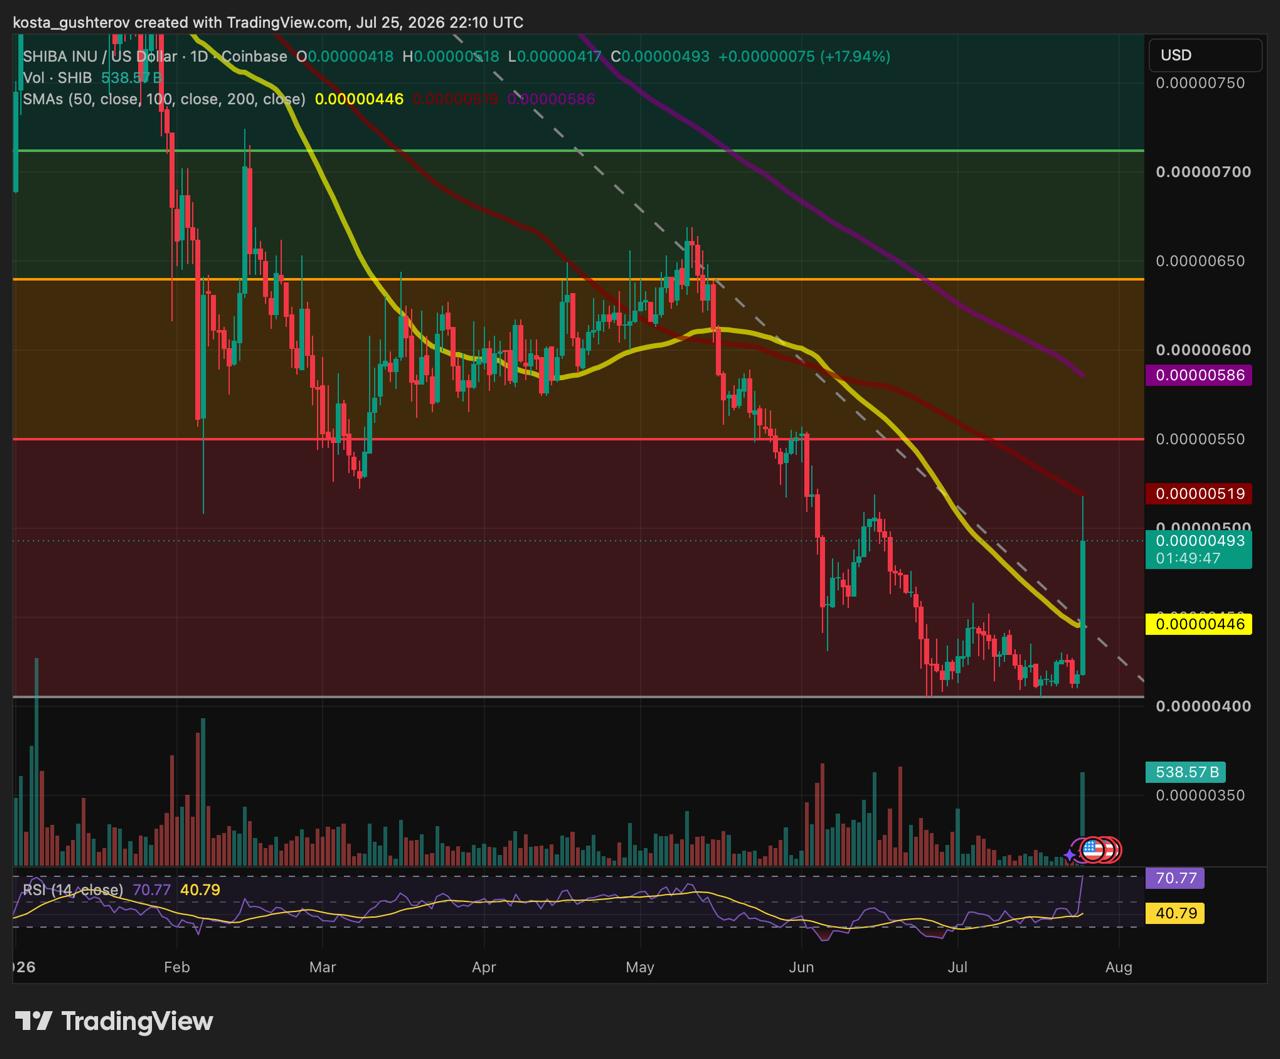
Shiba Inu (SHIB) rallied from a daily open near $0.0000042 to an intraday high of $0.00000518 — an advance of nearly 24% — before easing back to $0.0000049 at the time of writing. The move left SHIB approximately 18% higher over the session and came on the heaviest daily volume visible on the Coinbase chart, erasing several weeks of gradual losses in a single candle.
Price also broke above its recent descending trendline, reclaimed the 50-day simple moving average (SMA) at $0.0000044, and pushed as far as the 100-day SMA before retreating. Reports of increased token burns and whale accumulation contributed to the bullish narrative, but the scale of those developments remains too limited to explain the rally on their own. For a highly liquid meme token such as SHIB, single-session moves are often judged less by headline catalysts than by whether volume, market structure, and follow-through confirm participation beyond short-term speculation. The exceptional volume provides stronger evidence that the session reflected a genuine increase in market participation, though the still-open daily candle requires confirmation.
Volume: The Strongest Signal Behind the Move
Coinbase volume reached approximately 538.4 billion SHIB — the highest level visible on the chart since January. The surge coincided with SHIB breaking out of its July range near $0.0000041, indicating far greater activity than the sessions that preceded it.
While this strengthens the case for the rally, it does not reveal whether demand stemmed from spot accumulation, short covering, or traders chasing momentum. The key test ahead is whether SHIB can hold above the reclaimed 50-day SMA once volume begins to cool.
The reported 92% increase in the daily burn rate is less significant in absolute terms. Approximately 226.6 million SHIB were removed over 24 hours — worth roughly $1,120 at current prices and equal to about 0.000039% of circulating supply. The official SHIB token page describes burning as a cumulative supply-reduction mechanism, while the Shibarium burn portal links it to ecosystem activity. For this session, however, the volume spike offers a far stronger explanation for the price action than the number of tokens burned.
Whale Position Too Small to Explain the Rally
According to a report citing Arkham Intelligence data, a wallet inactive for eight months resumed buying and now holds more than 50.25 billion SHIB acquired through Binance. The figure appears to reflect the wallet's total position rather than a single purchase made immediately before the rally.
At the time of writing, that position was worth approximately $249,000 — around 0.0086% of SHIB's circulating supply. While significant for a single wallet, it is far too small to account for the broader move. A Binance withdrawal would modestly reduce available exchange supply, but one wallet cannot establish a market-wide trend. Confirmation would require similar withdrawals across multiple large holders, falling exchange balances, or continued accumulation after the price had already moved.
The available data also lacks a full transaction history, so the exact timing and size of individual purchases cannot be verified. The most reasonable interpretation is that at least one large holder renewed interest near recent lows — not that this wallet explains the rally.
100-Day SMA Rejected the First Advance
SHIB's daily high of $0.00000518 effectively matched the 100-day SMA near $0.00000519. Price then retreated to approximately $0.0000049, confirming that sellers responded when the rally reached that average. With the daily candle still open at the time of writing, this remains an intraday test rather than a confirmed close — the level that matters is where SHIB settles, not where it briefly traded.
A daily close above the 100-day SMA would open room toward the 0.236 Fibonacci retracement near $0.0000054. Recovering that level would provide the first evidence that SHIB is extending beyond a short-term reversal from its July base.
The 200-day SMA near $0.0000058 would then represent the more consequential structural resistance. It sits below the 0.382 Fibonacci retracement around $0.0000063, placing two major barriers between the current price and a broader trend change.
SHIB therefore remains within a longer downtrend despite reclaiming the 50-day average. The latest candle has improved the short-term structure, but price is still below both the 100-day and 200-day SMAs. That distinction matters because a reclaim of the 50-day SMA can mark a short-term momentum shift, while the 100-day and 200-day averages are more commonly watched for evidence that a broader trend is changing.
RSI Highlights the Speed of Momentum Expansion
The 14-day RSI rose to approximately 71 after gaining close to 30 points during the session, moving the indicator above the conventional overbought threshold.
An RSI reading above 70 does not guarantee an immediate decline — strong rallies can remain overbought while price continues higher. However, the size and speed of this increase show that much of the short-term momentum arrived in a single session. That raises the probability of consolidation or a pullback before another sustained advance and reduces the reliability of projecting the initial candle directly toward every higher resistance level.
A close above the 100-day SMA followed by a successful retest would provide stronger continuation evidence. It would convert that average from immediate resistance into potential support, making a move toward $0.0000054 more credible.
50-Day SMA Now Defines the Breakout's Strength
Failure to close above the 100-day SMA would leave the initial resistance test unresolved rather than invalidate the entire rally.
The first downside level is the reclaimed 50-day average near $0.00000446. Holding above it would preserve the improvement in SHIB's short-term structure and allow price to consolidate without a full return to the previous range.
A daily close below the 50-day SMA would weaken that interpretation, placing the breakout candle's low near $0.0000041 back in focus and showing that buyers failed to defend the first major level recovered during the advance.
Losing $0.0000041 would be more damaging, as that area formed the base of the latest reversal. A drop below it would suggest the exceptional volume represented temporary short covering or speculative demand rather than the beginning of sustained accumulation.
The next few sessions will determine whether SHIB defends its improved structure or gives back the gains from a single high-volume candle. In practical terms, the most important signals are whether volume remains elevated relative to the prior range, whether the 50-day SMA holds as support, and whether SHIB can turn the 100-day SMA from resistance into a closing reclaim.
Disclaimer: This article is for informational and analytical purposes only and does not constitute financial or investment advice. SHIB is a volatile asset, and technical indicators or historical price patterns cannot guarantee future performance. Readers should conduct their own research before making financial decisions.
Methodology: Technical levels are based on the daily SHIB/USD Coinbase chart displayed through TradingView on July 25, 2026. Burn figures are based on the supplied tracker data, while whale information comes from a report citing Arkham Intelligence.

