Ethereum Bearish Sentiment Reaches Extreme as ETH Holds Near $1,850 Support
Key Takeaways
- •Ethereum's crowd sentiment has flipped bearish across X, Reddit, and Telegram three separate times in the past 30 days, according to Santiment data.
- •ETH is trading near $1,849, with $1,850 identified by multiple traders as a critical support level that must hold to preserve the current market structure.
- •Spot Ethereum ETF inflows, Layer 2 activity, and protocol upgrades have continued despite negative retail sentiment, signaling sustained institutional interest.
- •Analyst Web3Marmot identified a breakout from a multi-month downtrend line and projected potential price targets ranging from $2,200 to $4,000 and beyond.
- •Previous crowd sentiment dips on Santiment's chart preceded ETH rebounds of 14% and 7%, respectively, though the firm cautions that extreme negativity alone does not guarantee an immediate reversal.
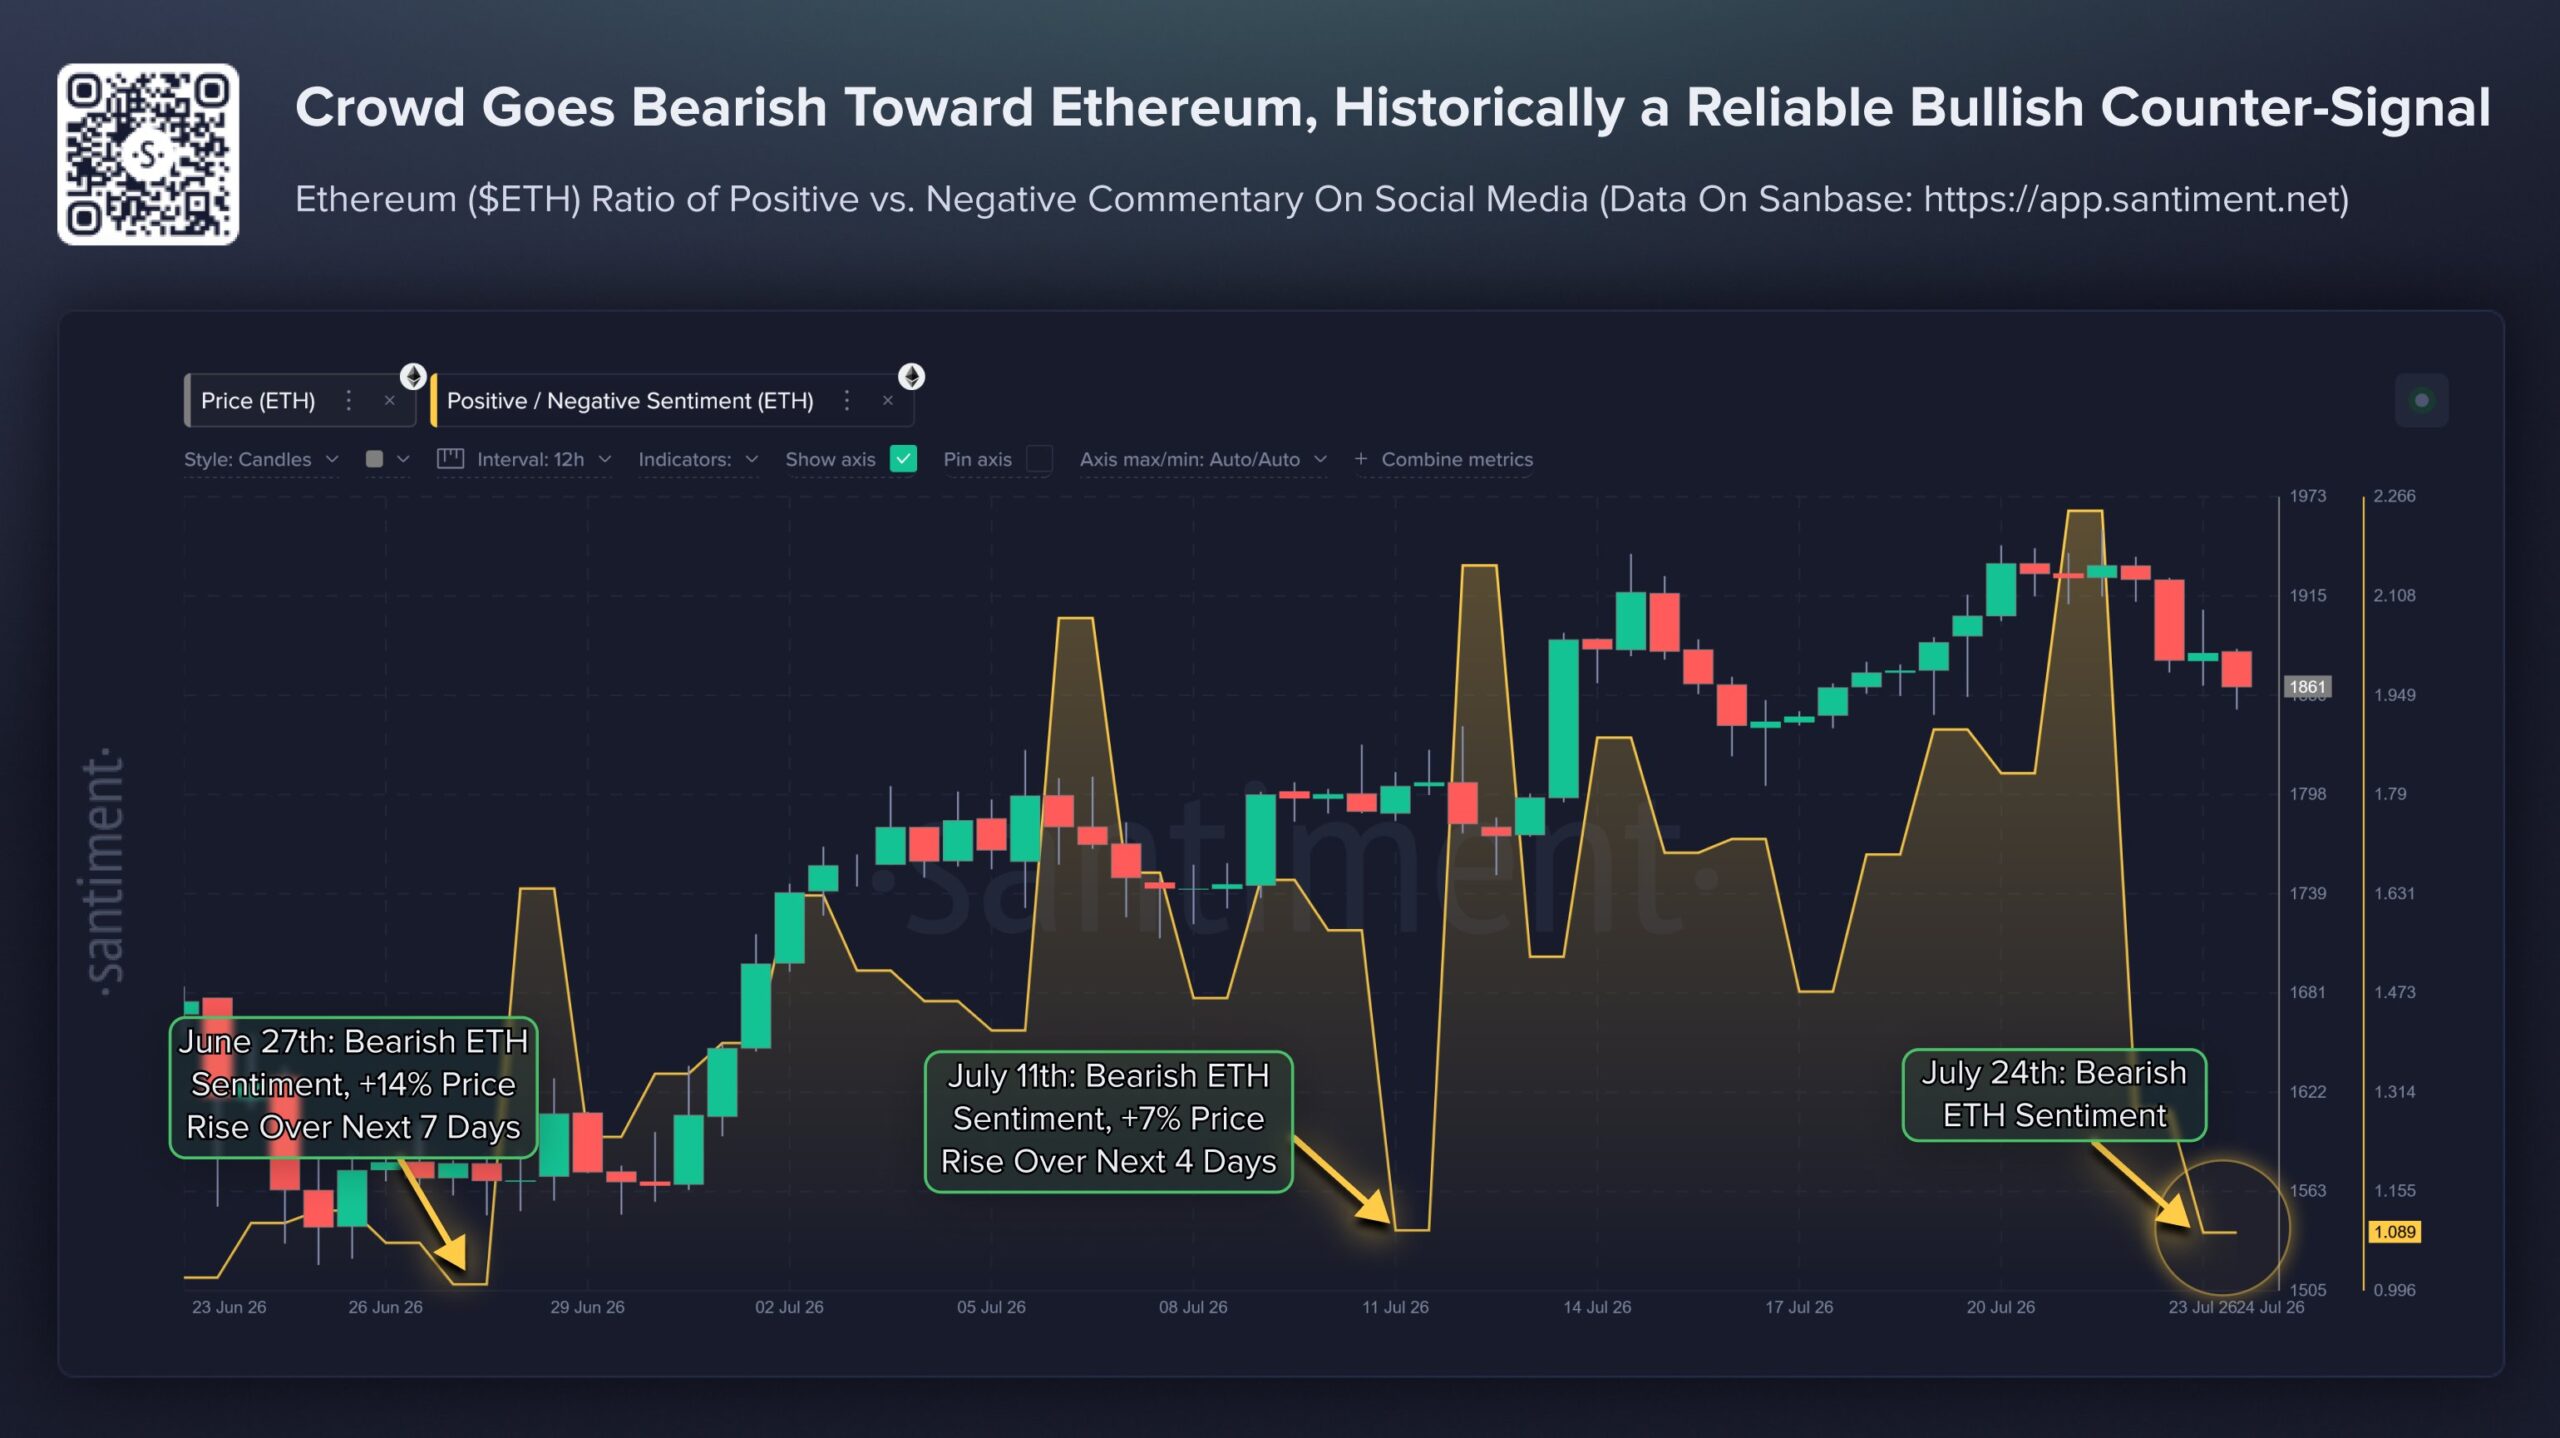
Ethereum's crowd sentiment has turned sharply bearish for the third time in a single month, even as the asset continues to trade near a critical support level that multiple analysts are watching for signs of a potential rebound.
According to on-chain analytics firm Santiment, Ethereum's positive-to-negative commentary ratio has flipped bearish across X, Reddit, and Telegram three separate times over the past 30 days. The most recent shift coincides with ETH trading near $1,850 — a level that several traders have identified as a key support zone.
Santiment noted that similar sentiment extremes have historically aligned with buying opportunities for ETH. Two prior dips in crowd sentiment on the same chart preceded rebounds of 14% and 7%, respectively. However, the firm cautioned that negative sentiment alone does not guarantee an immediate price reversal. Crowd sentiment metrics are widely used in crypto markets as contrarian indicators, where extreme negativity can signal that sellers have become exhausted — though the approach carries well-documented limitations and does not account for fundamental shifts in market structure.
Institutional Flows and Network Activity Persist Beneath the Surface
Even as public commentary has soured, ETF demand for Ethereum has continued to build. Santiment highlighted that ETF inflows, Layer 2 activity, and protocol upgrades have remained active beneath the surface, creating a notable contrast between negative retail sentiment and steady institutional interest. U.S.-listed spot Ethereum ETFs, which began trading in 2024 following SEC approval, have provided a regulated channel for institutional exposure to ETH, and their flow trends are now closely tracked alongside on-chain metrics as a gauge of sustained demand.
That divergence — bearish chatter paired with ongoing institutional flows — has drawn the attention of several market watchers this week.
ETH Price Holds Near Key Support
At the time of reporting, ETH changed hands at $1,849.24, representing a 2.11% decline over the past 24 hours. The token posted a modest 7-day gain of 0.48% alongside a 24-hour trading volume of $6.49 billion, according to CoinGecko data.
Trader Daan Crypto Trades described ETH's recent price action as a "choppy grind higher," noting that the token continues to print higher highs and higher lows on a local basis. He identified $1,850 as the level Ethereum needs to maintain in order to preserve that market structure. A break above approximately $1,950, he added, could open the path toward $2,150 and subsequently $2,350.
$ETH Still looks pretty okay. It's a very choppy grind up but we are still seeing higher highs and higher lows locally. If price can break back above ~$1950 (local highs) I think that would push this quite a bit higher at that point and test ~$2150 and ~$2350 after. Important… pic.twitter.com/73CqEbdYsQ
— Daan Crypto Trades (@DaanCrypto) July 24, 2026
Analyst Identifies Multi-Month Downtrend Breakout
Analyst Web3Marmot pointed to a separate technical development, stating that ETH had broken out of a multi-month downtrend line. He described the current phase as a retest and accumulation stage following that breakout.
His outlined scenario includes consolidation within a demand zone followed by an impulse move toward the $2,200–$2,400 range. Beyond that, he projected a breakout rally toward $3,000, with a further extension toward $4,000 and beyond. Web3Marmot also noted that when Ethereum confirms this type of breakout structure, major altcoins tend to follow with liquidity rotation — a pattern consistent with Ethereum's historical role as a bellwether for the broader altcoin market, where ETH direction often sets the tone for tokens built on its network.
Nobody is talking about this. But $ETH finally broke out of a multi-month downtrend line. Now we're seeing a retest and accumulation phase right before the real expansion. Here's how I expect the $ETH chart to play out: 1. Downtrend breakout & retest (DONE) 2. Consolidation… pic.twitter.com/DAjKAOFwaT
— MARMOT (@Web3Marmot) July 24, 2026
A Market Divided Between Caution and Positioning
The sentiment data and technical setups collectively illustrate a market split between short-term caution and longer-term positioning. Santiment's metrics show traders growing increasingly frustrated with ETH's price action near the $1,850 mark. Meanwhile, both Daan Crypto Trades and Web3Marmot frame the current zone as a pivotal area for Ethereum's next directional move — one where the intersection of extreme bearish sentiment, sustained institutional flows, and emerging breakout structures has created what many observers view as a defining moment for the asset's near-term trajectory.

