XRP Price Outlook for 2026–2030: Technical Support, ETF Inflows and Key Levels
Key Takeaways
- •XRP continues to hold above the $1.05-$1.10 Fair Value Gap, which remains central to its technical recovery structure.
- •Spot XRP ETFs posted $8.15 million in weekly net inflows after $6.78 million the previous week, lifting total assets to about $997.25 million.
- •Short-term resistance levels include $1.0939, the 20-day EMA near $1.1093 and the 50-day EMA around $1.1426.
- •Derivatives data showed trading volume fell 26% and open interest edged lower, suggesting fewer leveraged positions in the market.
- •The source forecast links XRP’s potential long-term gains through 2030 to sustained ETF demand, regulatory clarity and stronger crypto market conditions.
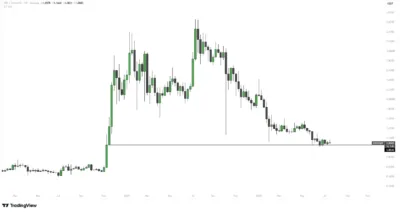
XRP is continuing to trade near $1.09 after several weeks of consolidation above a key technical support area. TradingView data shows the token compressing just above the weekly Fair Value Gap (FVG) between $1.05 and $1.10, a zone that has repeatedly drawn buyer support since the November 2024 rally.
The broader recovery structure remains intact while XRP holds above that range. Spot XRP exchange-traded funds (ETFs) have also posted two consecutive weeks of net inflows, lifting total assets under management to almost $1 billion. A recovery above the 20-day exponential moving average (EMA), alongside continued institutional demand, remains central to the long-term outlook through 2030 described in the source analysis.
Weekly Support Remains Central to the Recovery Structure
XRP’s weekly chart remains constructive despite the token spending several weeks in a sideways range. The price continues to respect the Fair Value Gap formed during the November 2024 breakout, with buyers repeatedly defending the upper part of the zone and preventing a weekly close below support.
In technical analysis, a Fair Value Gap is often treated as an area where price moved quickly enough to leave an imbalance that traders later monitor for support or resistance. For XRP, the importance of this range comes from repeated market reactions around the same zone rather than from a single intraday move.
This extended consolidation indicates that market participants have continued to hold or accumulate positions rather than exit them aggressively. As long as XRP remains above $1.05, the broader recovery structure remains technically intact.
Source: TradingView
Another factor supporting the technical setup is XRP’s repeated rejection of deeper corrections during periods of reduced trading activity. Such price behavior is commonly interpreted as a sign that longer-term holders remain willing to maintain exposure through temporary weakness.
Short-Term Indicators Show XRP Between Support and Resistance
On the hourly chart, XRP remains positioned between nearby support and resistance levels. The token is trading near the lower Bollinger Band at about $1.0849, while the Bollinger Band midline is near $1.0894 and the upper band is close to $1.0939.
The hourly Parabolic SAR continues to print above the price at around $1.0930, showing that sellers still retain short-term control. At the same time, the Bollinger Bands have narrowed considerably, a setup often associated with an eventual expansion in volatility.
Because volatility compression does not indicate direction by itself, the nearby resistance and support levels remain the main reference points for confirming whether momentum is improving or weakening. The descending trendline drawn from the July 22 high near $1.16 continues to cap upside attempts. A breakout above that resistance would likely improve the technical setup and increase the probability of a move toward higher resistance levels.
XRP ETF Inflows Extend for a Second Consecutive Week
Institutional participation remains one of the main factors cited in the XRP outlook. According to SoSovalue, XRP ETFs recorded $8.15 million in weekly net inflows, following $6.78 million in the previous week. That marked a second straight week of positive flows.
Total assets in XRP ETFs now stand at approximately $997.25 million, placing the products just below the $1 billion threshold. The continued inflows show that institutional investors are still allocating capital despite XRP’s relatively narrow trading range.
ETF flows are closely watched because they can reflect demand through regulated investment vehicles rather than only spot exchange activity. Sustained demand from these investment products could offer additional support if broader cryptocurrency market conditions improve. The inflow trend also keeps institutional participation in focus as a key variable for XRP’s longer-term market structure.
Derivatives Data Indicates Reduced Selling Pressure
Recent derivatives data suggests traders have become more cautious rather than broadly aggressive on the bearish side. Trading volume declined by 26%, while open interest also moved slightly lower, indicating fewer leveraged positions entering the market during the weekend.
Long liquidations totaled approximately $3.60 million, compared with only $136,220 in short liquidations. That imbalance shows the recent decline primarily removed leveraged bullish positions rather than triggering widespread bearish positioning.
Liquidation data is useful because forced closures can amplify short-term price moves when leverage is high. In this case, the combination of lower open interest and heavier long liquidations points to a market where speculative bullish exposure has been reduced, while broad short positioning has not materially expanded based on the figures cited.
At the same time, Binance’s top traders continued to maintain a 3.14 long-to-short account ratio. The source analysis said this indicates that experienced market participants still expect higher prices over the medium term.
Key Technical Levels for XRP
Several technical levels are likely to shape XRP’s next major move. Immediate support remains near $1.0849, while stronger structural support is positioned between $1.05 and $1.00. Maintaining those levels would preserve the broader bullish structure described in the analysis.
On the upside, XRP would first need to reclaim hourly resistance near $1.0939. The next level is the daily 20-day EMA around $1.1093. A sustained recovery above those areas could turn attention toward the 50-day EMA near $1.1426, with further upside extending toward the 0.618 Fibonacci retracement around $1.1822.
These moving averages matter because they are commonly used to assess whether short-term recoveries are turning into broader trend improvements. Until XRP reclaims them, the token remains technically supported but still constrained by nearby resistance.
Legislative developments related to the CLARITY Act could also affect investor sentiment if regulatory progress occurs before the Senate recess.
Source: TradingView
XRP Price Forecast for 2026–2030
2026
If XRP maintains support above the weekly Fair Value Gap and ETF inflows remain positive, the source analysis said the cryptocurrency could gradually recover toward $2.10 as institutional demand strengthens.
2027
Improved regulatory clarity, wider cryptocurrency market expansion and continued institutional participation could help XRP challenge the $2.90 region, according to the forecast.
2028
A stronger crypto market cycle, combined with broader adoption of XRP-based financial infrastructure, may allow the asset to revisit $3.50, matching a previous major resistance level.
2029
Growing liquidity, sustained ETF demand and increased cross-border payment adoption could support a move toward $4.40 if long-term momentum remains favorable.
2030
If XRP continues to attract institutional investment while maintaining broader market leadership, the cryptocurrency could target approximately $5.20, which would represent a significant extension of its long-term recovery.
Outlook
XRP remains technically supported as it continues to defend the weekly Fair Value Gap that has underpinned the broader recovery. Short-term momentum is still limited by nearby resistance levels, but two consecutive weeks of ETF inflows and resilient institutional positioning remain important factors in the longer-term setup.
The coming months will likely depend on whether XRP can reclaim higher moving averages while holding support above $1.05. Continued institutional accumulation, improved regulatory clarity and stronger cryptocurrency market conditions are the main conditions cited in the source forecast for a gradual move toward higher price targets through 2030.
FAQs
Why is the $1.05-$1.10 Fair Value Gap important?
The weekly Fair Value Gap has repeatedly acted as support, making it one of the most important technical zones sustaining XRP’s broader recovery.
Why do XRP ETF inflows matter?
Consistent ETF inflows indicate institutional demand, which can provide longer-term price support during periods of sideways trading.
What resistance levels are important for XRP?
The immediate resistance levels cited are $1.0939, $1.1093 and $1.1426, with stronger bullish momentum expected above those areas.
Can XRP reach $3.50 again?
The source forecast said XRP could revisit $3.50 during the 2028 timeframe if institutional demand keeps growing, regulatory developments remain favorable and the broader crypto market strengthens.
What could weaken XRP’s bullish outlook?
A sustained weekly close below the $1.05 support zone, weaker ETF demand, lower institutional participation or unfavorable regulatory developments could delay XRP’s long-term recovery.

