XRP Breaks Below $1 as RSI Hits Lowest Since 2013, Putting $0.80 in Focus
Key Takeaways
- •XRP broke below the $1 mark on Nov. 14, hitting $0.8930 on Binance before closing at $0.9144, after declines of roughly 4% in 24 hours, 15% in a week, and more than 25% in a month.
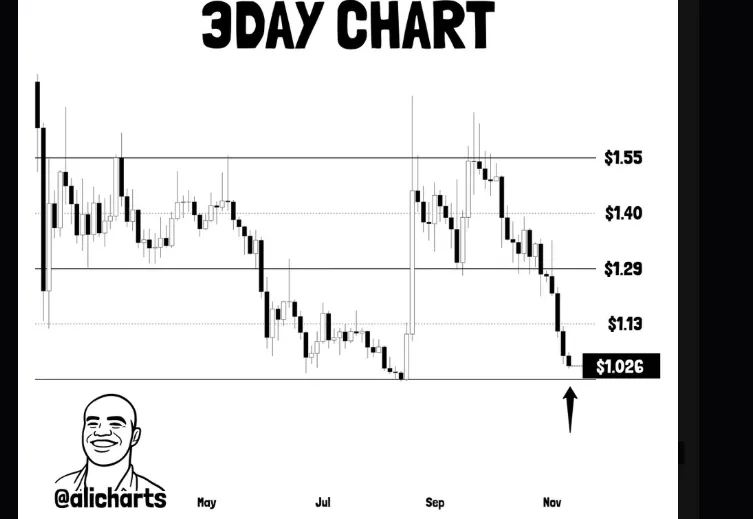
- •Analyst Ali Martinez identified $0.99 as crucial support on the three-day chart, and losing it could open a decline toward $0.80, with a further major support area near $0.75 flagged by a TradingView analysis.
- •XRP's Relative Strength Index has fallen to approximately 19, its lowest reading since 2013 and well below the conventional oversold threshold of 30, while the Stochastic oscillator near 3 to 5 and the Commodity Channel Index between -130 and -143 point to one-sided selling.
- •Coinbase recorded two consecutive days of net XRP buying after heavy selling during the earlier decline, according to analyst CW8900.
- •XRP is approaching a long-term ascending trendline near which prior cycle lows formed in March 2020 and July 2024, with Fibonacci extension projections at $6.81, $10.30, $16.17, and $31.64 representing possible upside scenarios rather than confirmed targets.
XRP's outlook turned bearish after the token broke below the $1 mark on Nov. 14 amid broader market weakness. According to CoinGlass data, XRP dropped to $0.8930 on Binance before closing the session at $0.9144. The move pushed the asset beneath a support zone that analysts had monitored for weeks, and several technical indicators slipped into oversold territory, raising questions about a possible rebound. Still, the latest price action has weakened the case for an immediate recovery, and traders are now watching resistance near $0.99 while lower technical levels come under scrutiny. Round-number thresholds such as $1 tend to draw outsized attention because they act as widely shared reference points for sentiment, which is part of why the break below $1 featured across so much analyst commentary.
Key points:
- XRP is approaching a long-term ascending trendline that preceded major rallies in 2021 and 2025.
- The token's RSI has fallen to its lowest level since 2013.
- XRP must defend $0.99 to avoid a possible decline toward $0.80.
XRP Slips Below $1 After Losing Key Support
XRP was trading around $0.98 after losing roughly 4% over 24 hours. The token has also fallen 15% over the past week and more than 25% over the previous month, and buyers have struggled to halt the selloff as the price approaches another support level. Stretched moves like this one are why the levels discussed below — $0.99, $0.80, and the $0.75 region — are being tracked so closely: they mark zones where buyers previously stepped in.
Crypto analyst Ali Martinez identified $0.99 as a crucial support level on XRP's three-day chart. The token previously failed to break above $1.55 before sliding toward the lower boundary of its trading channel. Losing that boundary could open the way for another decline toward $0.80.
The three-day chart also shows XRP back in a price area where buyers previously entered the market, although selling pressure has continued near that level.
Meanwhile, a separate TradingView analysis places another important support area near $0.75. The monthly chart shows XRP moving within a long-term ascending channel, with the lower trendline approaching that price. A sustained move below $0.75 would break the channel's support structure and leave room for further losses.
XRP's RSI Falls to Lowest Level Since 2013
Market analyst Dark Defender reported that XRP's RSI has dropped to its lowest reading since 2013. The Relative Strength Index is a momentum indicator that measures the pace and size of recent price moves, and readings below 30 are conventionally treated as oversold — a description of how heavily selling has dominated, not on its own a signal that a rebound is due. The shared chart places the indicator near 19, well below the usual oversold threshold of 30, while the RSI moving average remains higher at around 31.
Other indicators show that sellers have dominated recent trading. The Stochastic oscillator sits near 3 to 5, and the Commodity Channel Index ranges between -130 and -143. Both are momentum gauges traders use to assess whether an asset has been stretched in one direction, and both are pointing to the same heavily one-sided trading as the RSI.
However, buying activity has appeared on Coinbase despite the broader market weakness. Crypto analyst CW8900 reported that the exchange recorded two consecutive days of net XRP buying after heavy selling during the earlier decline. Exchange buying data of this kind is closely watched because it shows whether order flow is tipping toward buyers or sellers during a drawdown.
Can Long-Term Support Trigger Another Rally?
A long-term view shows the Ripple token approaching an ascending trendline that has supported previous market recoveries. The same trendline came into focus during the 2020 and 2024 market declines. XRP fell to $0.1103 in March 2020 before recovering to $1.96 in April 2021, and a later decline brought the token to $0.3834 in July 2024. The subsequent recovery eventually pushed XRP to $3.66 in July 2025. That history is what draws attention to the trendline now: prior cycle lows formed near it, though past structure offers no assurance of a repeat.
A separate two-week chart from EGRAG CRYPTO identifies $0.75 to $0.85 as a major support area. XRP is also testing a descending trendline while trading near its 21-period exponential moving average, a setup similar to those seen in earlier market cycles, although another recovery remains uncertain.
The long-term analysis also identifies Fibonacci extension levels at $6.81, $10.30, $16.17, and $31.64. Fibonacci extensions are chart-based projections analysts use to map where an advance could extend if an uptrend resumes. These levels represent possible upside scenarios rather than confirmed price targets, and buyers would first need to reclaim the descending trendline and the moving average.
For now, XRP faces its nearest support test around $0.98 to $0.99. A sustained breakdown could expose $0.80, followed by the broader $0.75 support region. With momentum indicators at multi-year extremes and spot buying re-emerging on Coinbase, the sessions ahead provide a clear test of whether those support zones hold or give way.
Source: The Market Periodical

