XRP Rebounds to $1.49 After $1.24 Liquidity Sweep as Traders Map the Next Levels
Key Takeaways
- •XRP briefly dropped to $1.2369 overnight to sweep resting stop-losses below a multi-week low, then rallied more than 5% in 24 hours to trade near $1.49.
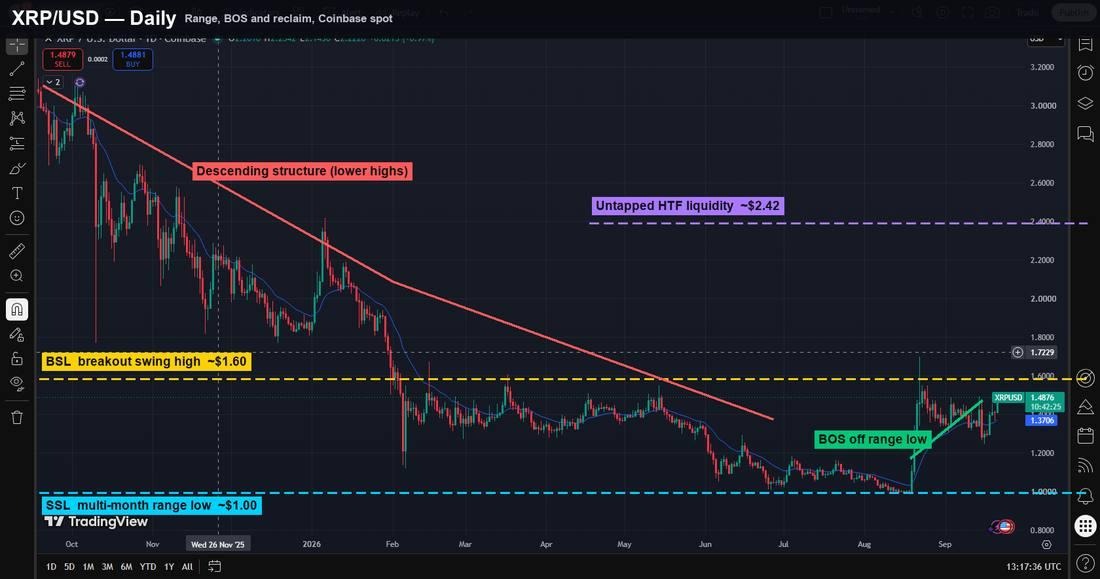
- •The token had spent about seven months ranging between roughly $1.00 and $1.60 following its decline from the November 2025 high near $2.95, with the $1.00 floor swept twice before the breakout.
- •CoinGlass liquidation heatmaps show a dense cluster of short positions between $1.50 and $1.51, whose forced covering could accelerate a move above that zone toward the $1.50-$1.55 supply area.
- •Funding stayed near neutral while open interest climbed over 9% in a day with nearly balanced long-short positioning at roughly 52% to 48%, suggesting spot demand drove the rally, and large holders added about 1.54 billion XRP, worth around $2.2 billion, over a 96-hour stretch.
- •An hourly close below $1.44 would invalidate the bullish structure and could open a retest of the $1.30 region, while a daily close under $1.35 would signal that the bullish structure built since mid-September has failed.
XRP swept its stop-loss cluster near $1.24 overnight, then broke short-term structure on the hourly chart — leaving behind the liquidity map that traders are now watching for the token's next move.
A wick to $1.2369 on the hourly chart lasted barely twenty minutes, disappearing almost as quickly as it appeared. By the time many traders registered the red candle, XRP had already turned the other way. The token is up more than 5% over the past 24 hours and trading near $1.49 against the dollar.
The move was not random noise. It followed a clean liquidity sweep below a multi-week low — precisely the kind of move XRP traders typically wait for before trusting a genuine shift in market structure The mechanics explain why: stop-loss orders convert to market orders the moment they trigger, so a dip through a stop cluster hands those exits to whoever is bidding underneath, which is why traders read the wick itself as information.
Seven Months of Range-Bound Trading
On the daily chart, the picture becomes clearer, or at least less noisy. XRP spent close to seven months grinding sideways between roughly $1.00 and $1.60. That range emerged from a much larger decline from the November 2025 high near $2.95, and it dragged on longer than most participants expected.
Lower highs kept stacking on top of one another. Every rally into resistance was sold, over and over, until the pattern became almost monotonous to watch. The $1.00 floor turned into an obvious pool of resting sell orders and stop losses — the kind of level a market maker typically wants cleared out before anything significant happens.
That pool was swept twice, not once. Each pass forced those resting stops into the book and cleared them out — the reset traders had been waiting for before trusting any break out of a range that had run seven months.
Chart sources: TradingView / Coinbase (XRP/USD daily and weekly timeframes).
The Weekly Picture Remains Heavy
On the weekly timeframe, the backdrop is still heavy. XRP topped near $3.66 in mid-2026 and has been stuck in a broad distribution phase ever since, cutting through one support shelf after another on the way to this year's low.
That old high still holds resting buy-side liquidity that no one has returned to touch. It sits far above the current price, so it is not part of the immediate setup, though it matters for anyone thinking in months rather than hours. What actually decides this week sits much closer to the current price.
The Order Block Behind the Bounce
The 4H chart shows the mechanics. XRP based for days just under $1.10, then finally broke through the string of lower highs that had capped every earlier bounce. That base functions as the bullish order block — essentially the last significant cluster of selling before buyers took control.
Price never meaningfully revisited that zone afterward. It broke structure, ran cleanly through the September high, and now sits roughly 40% above where that base printed. A move of that speed usually requires a breather before continuing, and that pause is what followed.
The Setup on the Hourly Chart
The hourly chart is where the structure becomes specific. Price swept the $1.2369 low, tagged the stops sitting below the prior range, then broke market structure back above the September 15 swing high near $1.4975 — a textbook stop hunt into a bullish break, the kind of setup Smart Money Concepts traders build entire strategies around. For readers new to the term, Smart Money Concepts is a chart-reading framework that interprets price through where resting liquidity and larger orders are likely to sit, rather than through conventional indicators — which is why a sweep-then-break sequence carries so much weight with this crowd.
A pullback into the $1.38 to $1.40 zone, the return-to-order-block area, held without breaking the bullish structure. From there, price pushed straight back to the highs.
Traders structuring positions around this chart are watching entries closer to $1.4880, an invalidation level under $1.44 that would negate the bullish read, and a target zone between $1.50 and $1.55, where the next meaningful supply sits. That target is not merely a guess.
Liquidation data source: CoinGlass.
What the Liquidation Data Shows
Liquidation heatmaps estimate where leveraged positions sit by price level, so a dense band marks the zone where forced closes would concentrate. CoinGlass's liquidation heatmap for XRP/USDT perpetuals shows exactly that: a thick cluster of short positions parked between $1.50 and $1.51, accumulated over the past day of consolidation directly below that level. A break above it would put a wave of forced buying from covering shorts in play — the kind of move that tends to run faster than the chart alone would suggest.
Funding — the recurring payment exchanged between perpetual traders that keeps contract prices tethered to spot — has stayed close to neutral throughout, which is worth noting. It never spiked into the extreme positive territory that typically marks an overheated, leverage-chasing rally. Open interest across the derivatives market did climb more than 9% in a single day, but long and short positioning remained nearly even, at roughly 52% to 48%. A sharply rising price alongside such balanced leverage usually points to spot demand doing the actual work, rather than perpetual traders piling in.
On-chain whale data points in a similar direction. Large holders added roughly 1.54 billion XRP — about $2.2 billion at current prices — over a 96-hour stretch, according to on-chain data covered by Live Bitcoin News. There is also an inverse head-and-shoulders pattern on the daily chart pointing at the same $1.55 neckline the liquidation data already flagged, an alignment that is difficult to overlook. A similar dynamic appeared in Cardano's own liquidation data this week, where clustered short positions ended up fueling a bounce instead of capping it.
Where the Idea Breaks Down
None of this holds if XRP loses the $1.44 area on an hourly close — and it could. Such a loss would put the return-to-order-block zone back in play and open the door to a retest of the $1.30 region, essentially the base of the entire move. A daily close back under $1.35 would be the clearer signal that the bullish structure built since mid-September has actually failed rather than merely paused.
This is not financial advice, simply a read of the chart and the liquidity sitting behind it. XRP can flip any of these levels within hours if the wider crypto market turns, so position sizing should account for that risk.

