XRP Golden Pocket Holds Again as Bulls Target $1.34 Breakout
Key Takeaways
- •XRP is testing the golden pocket support band near $1.24-$1.26 for a second time, and daily closes have held above $1.26 since October's slide.
- •The support structure is stronger than in September because the 100-day moving average has climbed to meet the 200-day near $1.28, creating three overlapping layers of support.
- •XRP rallied about 71% in roughly a week during August, from around $0.99 to a spike high near $1.70, and now trades about 22% below that peak.
- •Tuesday's bounce from near $1.30 stalled at the 0.5 Fibonacci retracement at $1.34, with the 50-day moving average at $1.41 and the 0.382 Fibonacci level at $1.43 capping further upside.
- •The daily RSI has hooked higher to about 42 and crossed back above its signal line, but it remains under the 50 midpoint, and each bounce this month has peaked lower than the last.
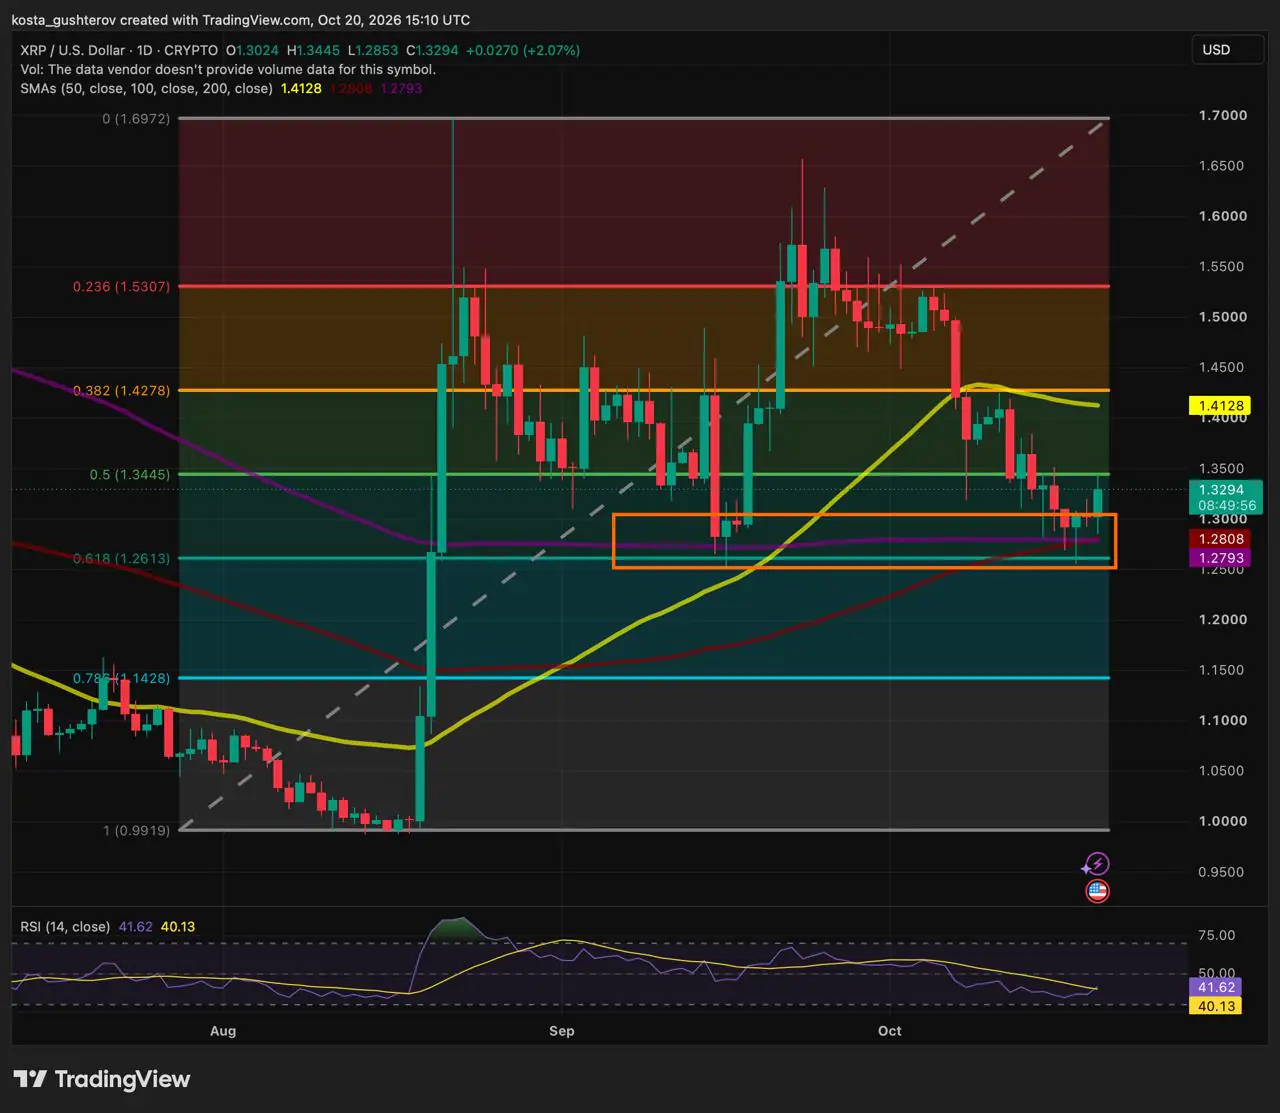
XRP, the native token of the XRP Ledger, is holding a closely watched technical support zone for a second time, with the price wedged between resistance at $1.34 and a floor near $1.24-$1.28. The token sits about 22% below its August high near $1.70, and its daily relative strength index (RSI) reads about 42, back above its signal line near 40.
Support comes from the so-called golden pocket between roughly $1.24 and $1.26, which sits just under the 100-day and 200-day simple moving averages (SMAs) near $1.28. Moving averages track the average daily close over a set window, and the 100-day and 200-day lines are among the most widely followed gauges of longer-term trend. Overhead, the 50-day SMA around $1.41 and the 0.382 Fibonacci retracement near $1.43 cap the upside.
October's Pullback Lands on the Golden Pocket
XRP's August breakout carried the price from around $0.99 to its spike high, a 71% run in roughly a week. The first pullback, in mid-September, found its floor at the 0.618 Fibonacci level of that rally, near $1.26. XRP wicked briefly below the level, then recovered above $1.50 within about a week.
That level marks the top of what traders call the golden pocket: the band between the 0.618 and 0.65 Fibonacci retracements of a move. Fibonacci retracements are chart levels set at fixed ratios of a prior price swing, and traders watch them as areas where pullbacks may stall. The golden pocket is among the most closely watched zones on any chart, because deep pullbacks within a healthy trend often attract buyers there, while a clean break below is usually read as a sign the original move has lost its footing. For XRP's August rally, the golden pocket sits roughly between $1.24 and $1.26.
The October slide stopped in the same area. A wick dipped into the golden pocket last week, but daily closes have held above $1.26.
What differs this time is the structure around the zone. In September, the 200-day SMA already sat near $1.28, but the100-day SMA trailed far below at around $1.17. The 100-day has since climbed to meet the 200-day, and both now rest just above the golden pocket, giving the floor three layers instead of two.
The Bounce Stalls at the 0.5 Fib
XRP opened Tuesday near $1.30 and climbed to $1.34, where it tagged the 0.5 Fibonacci retracement before easing to around $1.33. The level held as support through much of September and gave way in mid-October. A daily close back above it would turn the bounce off the floor into a recovery of lost ground.
Heavier Resistance Waits at $1.41-$1.43
Above $1.34, the 50-day SMA near $1.41 sits just under the 0.382 Fibonacci level near $1.43, roughly 6% to 7% above the current price. The 50-day has rolled over since peaking in early October. Reclaiming that band would put XRP back inside its September trading range.
Momentum Starts to Turn
The RSI has hooked higher after drifting lower through October and has crossed back above its signal line. It remains under the 50 midpoint, so the turn is early, but it is the first shift in momentum to support the bounce off the floor.
RSI measures momentum on a scale of 0 to 100. Readings below 30 signal oversold conditions, readings above 70 signal overbought conditions, and 50 separates bearish from bullish momentum. At 42, XRP sits in the weak zone but has started to climb.
The Case Against the Floor
Each bounce this month has topped out lower than the last, and the 50-day SMA now slopes down. A stronger floor does not guarantee a stronger rebound, and a clean break below the golden pocket would leave little on the chart until the next Fibonacci level down.
XRP remains wedged between resistance at $1.34 and the golden pocket floor at $1.24-$1.28.
This article is provided for informational purposes only and does not constitute financial advice. Cryptocurrency prices are volatile.

