Foreign Home Purchases in the US Fall 76% From 2017 Peak, NAR Data Show
Key Takeaways
- •Foreign buyers purchased 67,100 US homes in the 12 months through March, down 76% from the 2017 peak of 284,500.
- •Buyers living in the US purchased 37,600 homes, while buyers living overseas purchased 29,500 homes, both well below their prior highs.
- •Canada remained the largest source of foreign home purchases with 10,700 homes, though that figure was down sharply from earlier peaks.
- •Buyers from China, Hong Kong, and Taiwan purchased 7,400 homes and accounted for $7.6 billion in spending, the largest dollar total among foreign buyer groups.
- •Florida, California, and Texas together accounted for about half of all foreign home purchases, showing the market is concentrated in a few states.
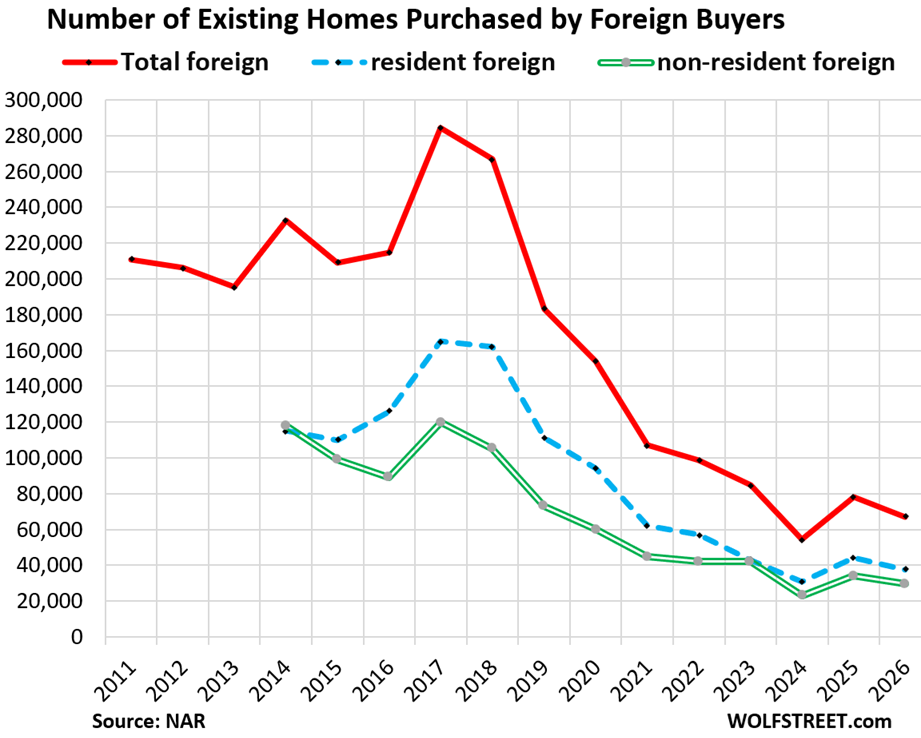
Home purchases in the US by foreign buyers — including both nonresident foreign buyers and foreign buyers who live in the US — fell again in the 12-month period through March and have declined by 76% from the 2017 peak to 67,100 homes, according to the National Association of Realtors’ annual report.
At the peak in the year through March 2017, foreign buyers purchased 284,500 homes. Purchases by foreign buyers who lived in the US fell 77% from that peak to 37,600 homes, while purchases by foreign buyers who lived overseas fell 75% to 29,500 homes.
The lowest level in the NAR’s annual foreign-buyer reports, which date back to 2009, was recorded in 2024.
Foreign buyers are concentrated in a limited number of US housing markets, where they can account for a meaningful share of demand. That concentration means changes in cross-border demand can matter most in specific states and metro areas rather than across the country as a whole, especially in markets that are already relatively expensive.
Canadian buyers ranked first with 10,700 home purchases in the 12-month period. That total was down 84% from the peak of 69,100 homes in 2010 and down 46% from 2019. Canadians spent an average of $486,000 per home.
The report does not include data on foreign owners who sold US homes. However, sporadic reports of sometimes desperate sales last year and this year by Canadians dissatisfied with conditions in the US suggest that Canadians may have become net sellers.
Buyers from Mexico purchased 9,400 homes in the 12-month period through March. That was down 69% from the peak of 30,100 homes in 2010 and down from 15,900 homes in 2019. They spent an average of $532,000 per home.
Buyers from China, Hong Kong, and Taiwan purchased 7,400 homes during the period, largely concentrated in some parts of California. Their purchases were down 82% from the peak of 40,600 homes in 2017. In 2010, when Canadian and Mexican purchases peaked, Chinese buyers were still increasing their activity.
Even so, they spent an average of $1.03 million per home because their buying was concentrated in expensive California markets. On a dollar basis, they accounted for $7.6 billion in purchases, making them the largest group in the 12-month period.
Major US brokerage firms continue to market US homes to buyers in China. Compass promotes US homes in China through its Mandarin-language website, Compass China, and Mandarin-speaking agents in the US. Compass also acquired Anywhere Advisors, the parent of Coldwell Banker, Century 21, and Sotheby’s, which also market US homes in China. Berkshire Hathaway HomeServices, the real estate arm associated with Warren Buffett, entered China at the 2017 peak through a marketing agreement with Juwai.com to promote US homes to Chinese buyers.
Buyers from India purchased 6,000 homes, down 65% from the peak of 17,300 homes in 2015 and from 9,700 homes in 2019. They spent an average of $617,000 per home, with activity concentrated in expensive US tech markets.
Buyers from the UK purchased 2,700 homes and spent an average of $444,000 per home. Their purchases have fallen 90% from the peak of 27,100 homes in 2010.
By state, the three largest markets accounted for about half of all foreign purchases. Florida ranked first with 20% of foreign purchases, California was second with 19%, and Texas was third with 12%.
