'King of Debt': US Federal Debt at $40 Trillion Amid Fiscal Policy Uncertainty
Key Takeaways
- •Gross federal debt has reached $40 trillion, while debt held by the public, the measure most economists compare with GDP, stands at $32.3 trillion.
- •Net interest payments on the debt exceeded $880 billion in fiscal year 2024, more than the federal government spent on national defense that year.
- •The CBO's February 2026 debt projection was completed before the onset of the US–Iran war and before the Supreme Court invalidated tariffs imposed under the IEEPA.
- •The Bipartisan Policy Center estimates that announced policies pushed the deficit $209 billion above baseline in the first ten months of fiscal 2026, or roughly $250 billion when prorated over the full year.
- •The analysis attributes part of the current anxiety to uncertainty over fiscal policy, noting the administration has not presented a coherent plan for reining in the deficit.
"I am the king of debt. I do love debt. I love debt." That was Donald J. Trump, speaking in May 2016. Against that backdrop, the current anxiety over federal debt should surprise no one; it was only a question of time.
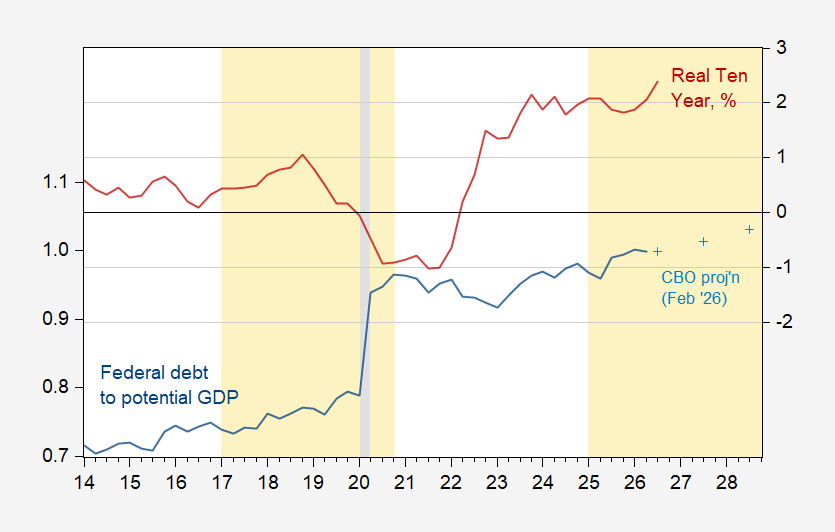
First, a technical point. The headline (gross) federal debt number is $40 trillion as of yesterday, while debt held by the public, which nets out intergovernmental debt, is $32.3 trillion. The distinction matters. The gross figure includes Treasury securities held by government trust funds such as Social Security's, and it is the measure that counts against the statutory debt limit Congress sets. Debt held by the public is what the nonpartisan Congressional Budget Office (CBO) and most economists compare against GDP — and on CBO's accounting it stood near 100 percent of GDP in 2025. Either way, the picture is worrying, and interest costs are part of the reason: net interest on the debt exceeded $880 billion in fiscal year 2024, more than the federal government spent on national defense that year.
Figure 1: Debt held by the public to potential GDP (blue, left scale), CBO projection of February 2026 (light blue +, left scale), 10-year TIPS yield, % (red, right scale). Q3 for the TIPS yield is the quarterly average through August 19. Light orange shading denotes Trump administrations; NBER-defined peak-to-trough recession dates. Source: CBO, Budget and Economic Outlook; Treasury via FRED; Treasury; and author's calculations.
While the debt-to-GDP projection does not look too alarming, it was constructed before the onset of the US–Iran war and before the Supreme Court decision striking down the IEEPA-based tariffs — levies imposed under the International Emergency Economic Powers Act of 1977, the statute the Administration used as the legal basis for its sweeping 2025 tariff program. For the first ten months of FY 2026, the Bipartisan Policy Center — a Washington think tank whose Deficit Tracker tallies enacted and announced policies against baseline projections — estimates the budget deficit ran $209 billion higher than projected due to announced actions, including a debatable $39 billion in Department of Defense expenditures associated with the war. Prorated, that adds about $250 billion to the FY 2026 deficit.
The CBO projection should therefore be considered somewhat "overtaken by events," even as it points in the right direction for the trend in debt-to-GDP. Part of the angst appears driven by uncertainty surrounding fiscal policy — indeed, overall economic policy formulation in this administration — especially as the Administration has evidenced no coherent plan for reining in fiscal policy. Markets offer one lens on that: the 10-year TIPS yield plotted in Figure 1 is the real, inflation-adjusted return investors demand for holding long-dated Treasuries. How much of the deficit overshoot persists should become clearer through the regular cadence of official updates — Treasury's monthly budget statements, the CBO's next baseline revision, and the BPC's running tracker.
Figure 2: Economic Policy Uncertainty, fiscal policy category (blue). Light orange shading denotes Trump administrations; NBER-defined peak-to-trough recession dates. Source: policyuncertainty.com.
Source: Econbrowser

