U.S. ETF Inflows Reach Record $1.93 Trillion Through September
Key Takeaways
- •U.S.-listed ETFs attracted a record $1.93 trillion in net inflows through September 29, a 43% increase over the same period in 2025.
- •Third-quarter inflows of $771 billion set a quarterly record and put annual flows on pace to exceed $2.5 trillion if sustained.
- •State Street estimated inflows above $1.54 trillion through September and projected they could approach $2.3 trillion by year-end 2026, requiring roughly $760 billion in the fourth quarter.
- •Equity ETFs led with more than $1 trillion in inflows, while fixed-income ETFs drew over $469 billion, showing demand spread across asset classes.
- •Index-weighted buying directs about 41 cents of every dollar into the S&P 500's ten largest companies even though only 25% of constituents traded above their 50-day moving averages in late September.
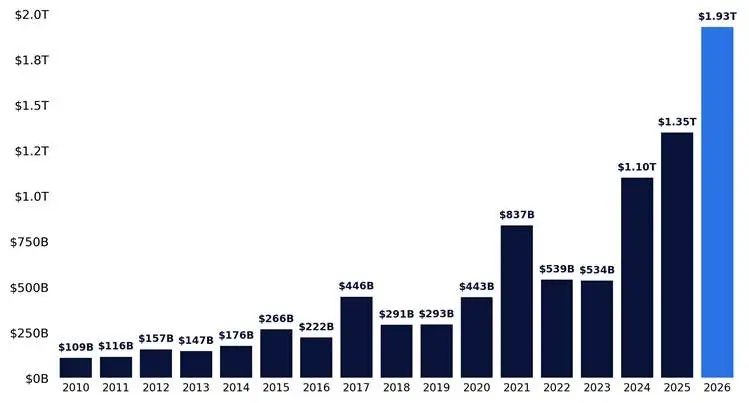
U.S.-listed exchange-traded funds attracted a record $1.93 trillion in net inflows through September 29, according to Bloomberg data compiled by Citadel Securities. The total was $580 billion, or 43%, higher than the comparable period in 2025.
ETFs trade on exchanges and pool money into baskets of stocks, bonds or other assets, giving investors exposure to broad markets through a single security. Net inflows count new money committed to those funds, so the 2026 totals reflect fresh allocations rather than gains from rising asset prices.
The third quarter accounted for $771 billion of the inflows, setting a new quarterly record. That pace equates to roughly $214 billion per month in 2026 and would put annual flows on track to exceed $2.5 trillion if maintained.
Citadel Securities published its figures in its market intelligence report.
BREAKING: US-listed ETFs have attracted +$1.93 trillion in inflows year-to-date, their largest intake in the first 3 quarters of the year on record. This figure is +$580 billion, or +43%, above the amount recorded over the same period in 2025. This also puts inflows for these… pic.twitter.com/Jbo749cdhF — The Kobeissi Letter (@KobeissiLetter) October 4, 2026
The surge has extended across both equity and fixed-income products rather than being concentrated in a single investment category. The breadth of the inflows has reinforced ETFs’ role as a vehicle for allocating capital across stock and bond markets.
Equity and Fixed-Income ETFs Attract Broad Demand
State Street Investment Management separately estimated that U.S.-listed ETFs had received more than $1.54 trillion in inflows through September. That figure had already surpassed the firm’s $1.52 trillion full-year record from 2025.
State Street projected that ETF inflows could approach $2.3 trillion by the end of 2026. Meeting that projection would require roughly $760 billion of fourth-quarter inflows, based on the firm’s September estimate. Its data showed equity ETFs leading with than $1 trillion in inflows, while fixed-income ETFs attracted over $469 billion through September.
Funds tracking U.S. stocks accounted for about $655 billion of the equity total. Technology-sector ETFs added more than $59 billion, indicating the scale of allocations directed toward funds holding market-leading companies.
The Citadel Securities and State Street figures differ because the two datasets use different coverage or methodologies. Neither report reconciled the gap, but both recorded historically strong demand for ETFs.
Assets across the fund industry also expanded. Investment Company Institute data showed that U.S. ETF assets reached $16.27 trillion in August, while indexed funds held $22.4 trillion. Indexed mutual funds and ETFs represented 54.3% of combined long-term fund assets, meaning index-linked products accounted for more than half of that market—a milestone in the industry’s shift toward indexed investing.
Index Flows Increase Mega-Cap Exposure
Citadel Securities estimated that the 10 largest companies in the S&P 500 receive about 41 cents of every dollar allocated to the index. The so-called Magnificent Seven receive roughly 35 cents. The index weights members by market value, so broad index funds buy constituents in those same proportions.
That concentration means broad index inflows direct a substantial portion of new capital toward the largest companies. At the same time, only 25% of S&P 500 constituents traded above their 50-day moving averages in late September, a level of narrow breadth that contrasts with the scale of new money entering broad funds.
Crypto ETFs also participated in the broader shift toward regulated fund structures, although their inflows remained small compared with the overall U.S. ETF market. U.S. spot Bitcoin ETFs attracted approximately $2.65 billion in September, while spot Ether ETFs received about $832 million, according to SoSoValue data. Combined, the two categories took in roughly $3.5 billion in September.
The figures show ETF demand spanning stocks, bonds, Bitcoin and Ether. Crypto products, however, represented only a small share of the record industry-wide inflows.

