Business Cycle Indicators: CES/CPS Employment Surges
Key Takeaways
- •Econbrowser's analysis of coincident indicators from BLS, Federal Reserve, and BEA data indicates continued growth in the U.S. economy.
- •The analysis tracks four key monthly series: nonfarm payroll employment, civilian employment, industrial production, and real manufacturing and trade sales, following the NBER's approach to dating business cycles.
- •The CES payroll survey and CPS household survey measure employment differently and can diverge in any given month, which is why analysts monitor both.
- •The latest employment release surprised in both its reported change and its revisions to previous months' figures.
- •CES revisions are routine, with estimates typically adjusted in the two subsequent releases and larger benchmark corrections occurring annually, so future data should be watched closely.
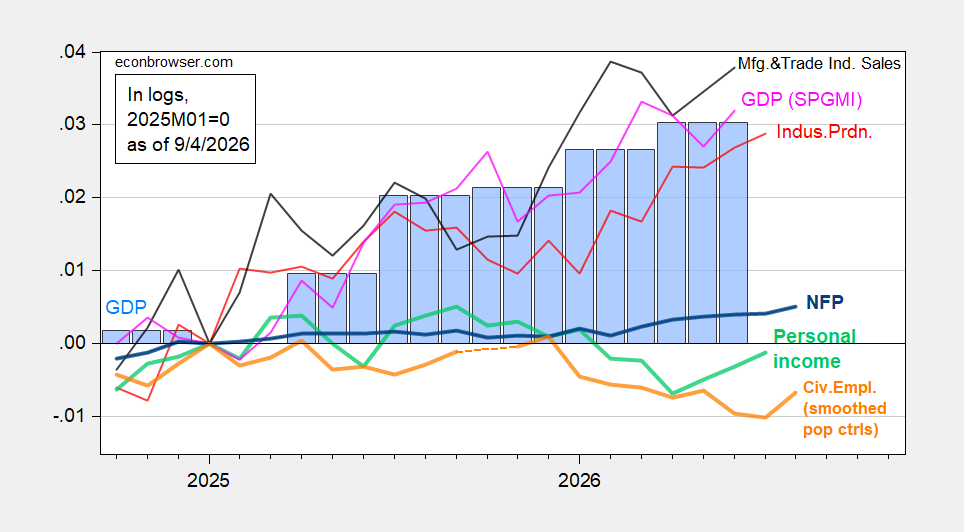
The latest business cycle indicators point to continued growth in the U.S. economy, according to Econbrowser's analysis of data from the Bureau of Labor Statistics (BLS), the Federal Reserve, and the Bureau of Economic Analysis (BEA).
The coincident indicators tracked in this analysis draw on four major monthly series published by U.S. statistical agencies: nonfarm payroll employment from the BLS Current Employment Statistics (CES) survey, civilian employment from the Current Population Survey (CPS), industrial production from the Federal Reserve, and real manufacturing and trade sales from the Census Bureau. These series are conventionally used to identify turning points in the business cycle, following an approach long associated with the NBER Business Cycle Dating Committee, which relies on coincident measures rather than any single headline number to judge expansions and recessions. The two employment series also measure different things: the CES surveys businesses about jobs on payrolls, while the CPS is a household survey capturing employment status, so the two can diverge in any given month — one reason analysts track both alongside production and sales data.
Figure 1: NFP employment (bold blue), civilian employment with smoothed population controls (bold orange), industrial production (red), personal income excluding current transfers in Ch.2017$ (bold light light green), manufacturing and trade sales in Ch.2017$ (black), and monthly GDP in Ch.2017$ (pink), GDP (blue bars), GDPNow nowcast of 7/10 (light blue box), all log normalized to 2025M01=0. Source: BLS via FRED, BLS, Federal Reserve, BEA 2026Q2 2nd release, S&P Global Market Insights (nee Macroeconomic Advisers, IHS Markit) (8/3/2026 release), and author's calculations.
Figure 2: Civilian employment adjusted to NFP concept smoothed population controls, using experimental controls for 2025 (bold orange), manufacturing production (red), ADP private nonfarm payroll employment (light green), real retail sales, CPI deflated (black), freight services indexes (brown), and coincident index in Ch.2017$ (pink), GDO (blue bars), all log normalized to 2025M01=0. Source: BLS, ADP via FRED, Philadelphia Fed, Bureau of Transportation Statistics, Federal Reserve via FRED, BEA 2026Q2 2nd release, and author's calculations.
Notably, the employment release surprised not only in terms of the reported change, but also in terms of revisions to previous months' numbers. Revisions are a routine feature of the CES — each month's estimate is typically revised in the two subsequent releases as more business survey responses arrive, with larger benchmark corrections following annually — so readers should watch how these figures settle in coming releases and how the household and payroll series move relative to one another.
Figure 3: Change in private nonfarm payroll employment from CES August release (black), from CES July release (gray), Bloomberg consensus based on implied change (light blue square), ADP (green), all in 000's, s.a. Source: BLS, ADP via FRED, and author's calculations.

