TFI First Look: Truckload Outperforms as LTL Trails
Key Takeaways
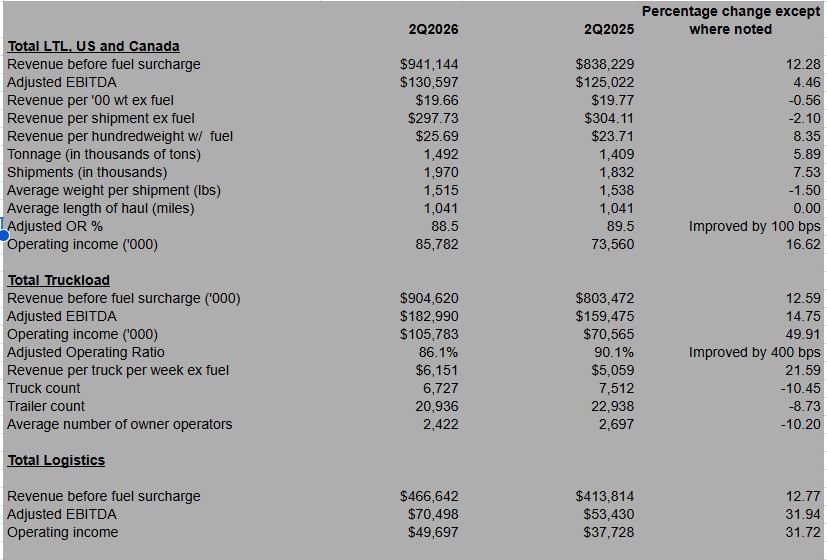
- •Truckload revenue increased 12.6% year over year in the second quarter, while adjusted EBITDA rose 14.75%.
- •Truckload revenue per truck per week excluding fuel increased 21.6%, but its operating ratio worsened by 400 basis points to 86.1%.
- •The LTL segment posted a 100-basis-point increase in operating ratio, while revenue per shipment excluding fuel fell 2.1% and adjusted EBITDA rose 4.46%.
- •TFI International’s net income rose to $136.2 million from $98.2 million a year earlier, and adjusted earnings per share increased to $1.86 from $1.34.
- •At June 30, TFI reported 11,987 trucks and 39,710 trailers, both below the prior-year totals, while independent contractors increased to 6,189 from 6,044.
TFI International’s flagship LTL operations in the second quarter improved versus a year earlier on some measures and softened on others, but the company’s truckload segment delivered the strongest results.
Truckload revenue for TFI International (NYSE: TFII) increased 12.6% from the second quarter of 2025. Adjusted EBITDA rose 14.75%, and the operating ratio (OR) worsened by 400 basis points to 86.1%. Revenue per truck per week excluding fuel increased 21.6%.
By comparison, the LTL segment posted a 100-basis-point increase in OR. Revenue per hundredweight excluding fuel, a key LTL benchmark, edged lower, and revenue per shipment excluding fuel declined 2.1%. Adjusted EBITDA rose 4.46%. For readers tracking freight cycles, those LTL pricing and efficiency measures are closely watched because they show how carriers are balancing volume, yield and cost in a segment where small changes can affect margins.
Adjusted EBITDA margins were 18% for LTL and 24.1% for truckload.
Overall, TFI’s results, including a solid performance in logistics, were significantly stronger. Net income climbed to $136.2 million from $98.2 million in the second quarter a year earlier. Adjusted earnings per share increased to $1.86 from $1.34.
For the six months ended June 30, the company’s revenue mix shifted compared with the same point in 2025. Manufactured goods accounted for 19% of revenue, up from 17% a year earlier. Retail fell to 16% from 19%, while automotive increased to 13% from 10%.
The report also showed a notably smaller equipment base. At the end of June, TFI had 11,987 trucks, 39,710 trailers and 6,189 independent contractors. A year earlier, the company reported 13,511 trucks, 42,726 trailers and 6,044 independent contractors. That fleet comparison provides useful context for how the company’s operating footprint changed over the year, alongside the segment-level revenue and margin results reported in the quarter.

