Stellar's XLM Slides Below Key Moving Averages as Derivatives Signals Turn Cautious
Key Takeaways
- •XLM traded near $0.160 on Thursday, sitting below its 50-day, 100-day, and 200-day exponential moving averages at $0.176, $0.180, and $0.190 respectively.
- •The long-to-short ratio for XLM weakened to 0.92, approaching its lowest point in over a month and indicating that short positions exceed long positions.
- •XLM's funding rate improved to 0.0092%, suggesting some traders are willing to hold long positions even as prices remain under pressure.
- •Momentum indicators remain weak with the Relative Strength Index near 33 and the MACD in negative territory, though the low RSI could eventually support a rebound.
- •If selling continues, XLM may fall toward its next horizontal support level at $0.142 where buyers may attempt to stabilize the price.
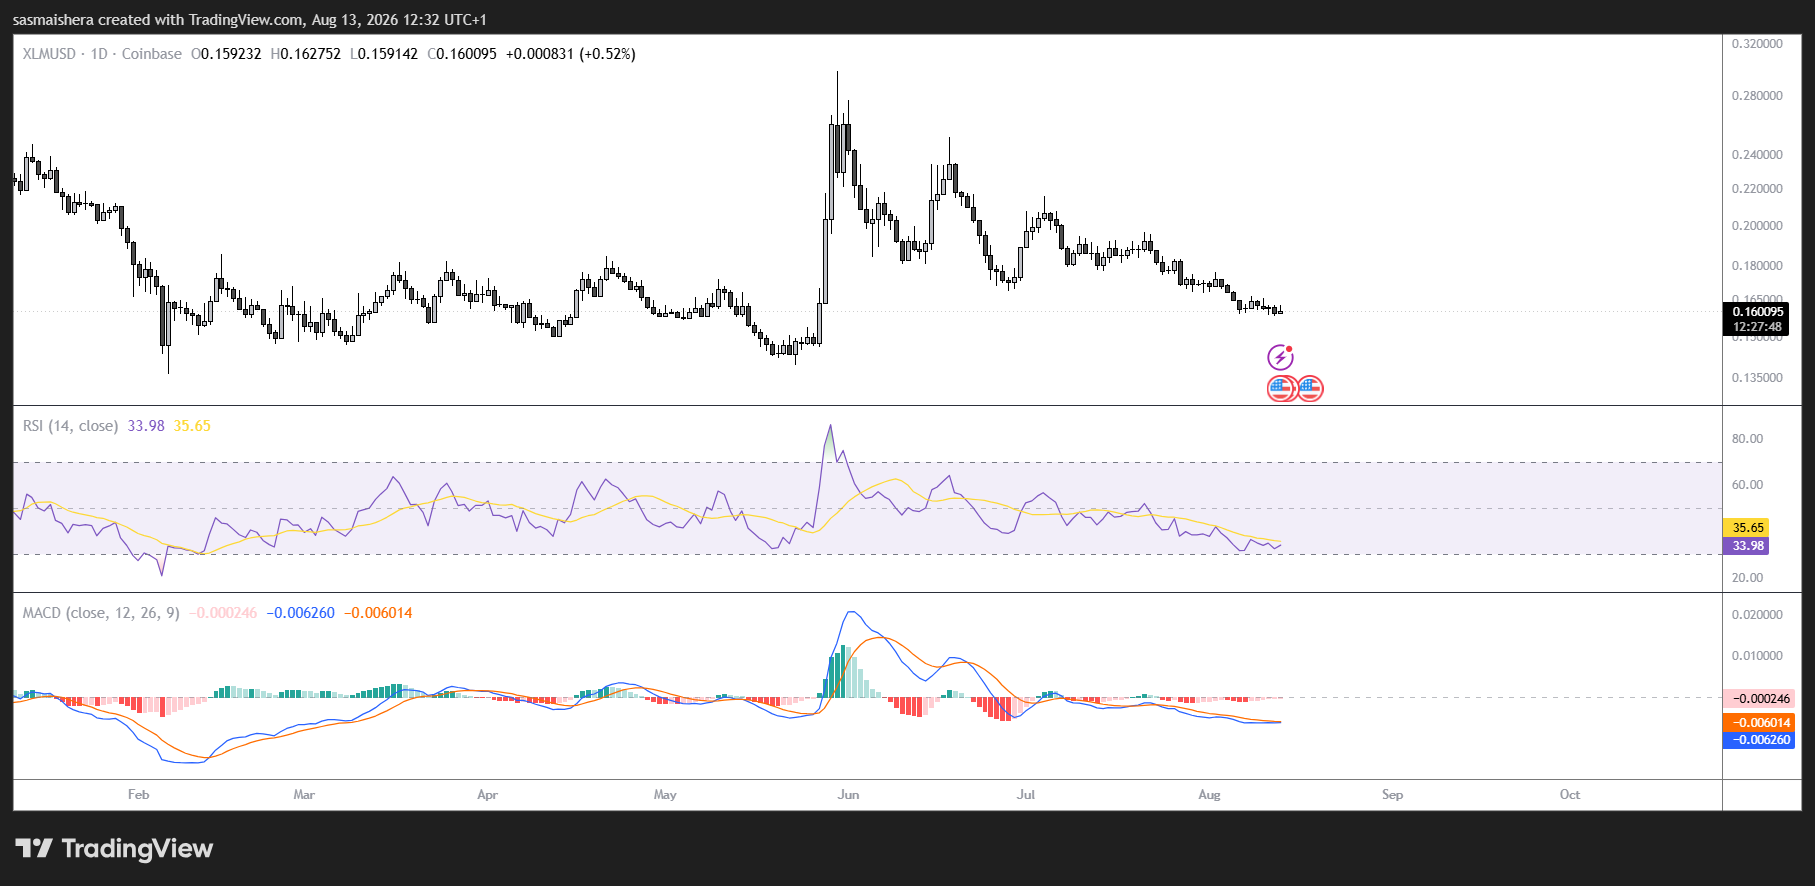
Stellar's XLM token continued to trade below several major moving averages on Thursday, with mixed derivatives and on-chain data highlighting growing uncertainty among traders. The token remains exposed to further downside pressure despite tentative signs of improving sentiment in the perpetual futures market.
Stellar operates a blockchain network focused on cross-border payments and remittances, positioning itself alongside Ripple's XRP in a segment that has seen renewed institutional interest as financial firms explore distributed ledger technology for settling international transfers. That backdrop has periodically driven speculative attention to both tokens, even as adoption timelines for production-grade payment networks remain uneven.
Mixed Positioning Among XLM Traders
CoinGlass derivatives data points to a more bearish outlook for Stellar. XLM's long-to-short ratio weakened to 0.92, approaching its lowest level in more than a month. A reading below one indicates that short positions outnumber longs, reflecting trader expectations of additional downside.
However, funding rates have improved despite weak price performance. XLM's funding rate climbed to 0.0092%. Positive funding means that traders holding long positions are paying short sellers, which generally signals bullish demand in the perpetual futures market. The figures suggest that some traders are willing to maintain long exposure while prices remain under pressure, though continued declines could leave those positions vulnerable to liquidation.
CryptoQuant data paints a similarly mixed picture for Stellar. The futures market shows selling-side dominance across both spot and derivatives venues. While the presence of large whale orders adds an element of uncertainty, the broader data continues to favor caution as sellers maintain control of trading activity.
Stellar Below Major Moving Averages
XLM traded near $0.160 on Thursday, maintaining a bearish short-term outlook below all three major exponential moving averages (EMAs). The 50-day EMA sits at $0.176, while the 100-day and 200-day EMAs stand at $0.180 and $0.190, respectively. Their convergence above the current price creates a dense resistance zone that buyers must overcome before any meaningful recovery can take hold.
Momentum indicators remain weak as well. XLM's Relative Strength Index (RSI) is near 33, placing it close to oversold territory, while the MACD continues to trade in negative terrain. Although the low RSI could eventually support a relief rally, it does not by itself confirm that XLM has reached a bottom.
The first important resistance zone sits between the 50-day EMA at $0.176 and horizontal resistance at $0.177. A break above this area could ease selling pressure and open the path toward the 100-day EMA at $0.180. Bulls would then need to clear the 200-day EMA at $0.190 to establish a stronger recovery.
If XLM remains below these levels, the bearish outlook will persist. Continued selling could push the token toward its next meaningful horizontal support at $0.142, where buyers may attempt to defend the price.
For now, XRP's slight bullish positioning in the derivatives market provides limited recovery hope, but both tokens remain technically vulnerable while trading below their major moving averages.

