Stock Buyback Statistics 2026: S&P 500 Repurchases Reach Record $1.02 Trillion
Key Takeaways
- •S&P 500 buybacks hit a record $1.02 trillion for the 12 months ending September 2025, an 11.1% increase and only the second trillion-dollar rolling annual total, after the period ended June 2022.
- •Buyback spending is heavily concentrated: Apple spent $96.7 billion over 12 months, and Apple, Nvidia, Alphabet and Meta together made up more than 22% of Q3 2025 repurchases, with the top 20 companies accounting for 49.5%.
- •Technology and financial sectors combined represented roughly 49% of 12-month buyback spending, with information technology at 27.6% and financials at 21.4%.Large 2026 authorizations, including Nvidia's $150 billion expansion and General Motors' $20 billion program, signal continued momentum but represent approvals rather than completed purchases and may be deployed over several years.
- •Only 17.1% of S&P 500 companies cut their diluted share count by at least 4% in Q3 2025 because new share issuance offsets much repurchase activity, and the 1% federal excise tax has not materially changed repurchasing behavior.
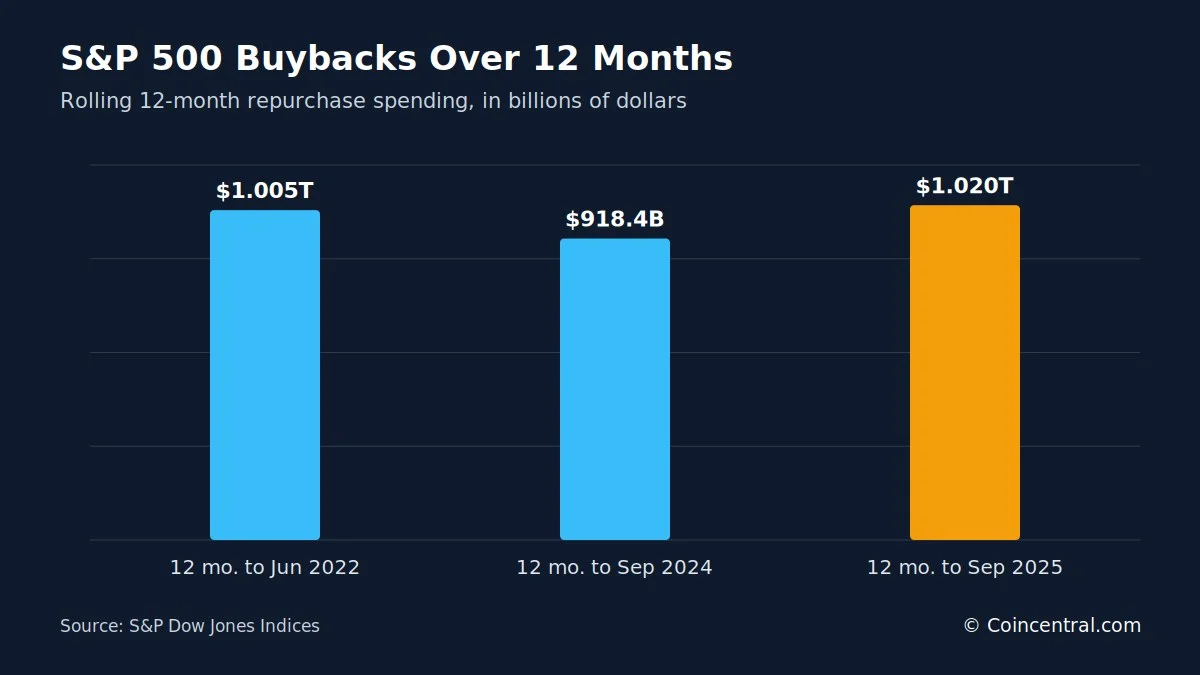
Stock buybacks have become one of the largest channels through which U.S. companies return cash to shareholders. S&P 500 companies spent a record $1.02 trillion on share repurchases in the 12 months ending September 2025, an increase of 11.1% from $918.4 billion in the prior 12-month period. Including dividends, total cash returned to shareholders reached a record $1.685 trillion.
The pace has continued into 2026. Nvidia approved a $150 billion expansion of its buyback program in September 2026, and General Motors announced a new $20 billion repurchase program in October 2026.
An authorization, however, is not the same as actual spending. A company can approve $100 billion in future purchases and then deploy it over several years — or never use all of it.
The most recent full release from S&P Dow Jones Indices covers the third quarter of 2025. This article uses that dataset for index-wide totals and treats 2026 company announcements as a separate measure.
Key Stock Buyback Statistics at a Glance
The figures below provide a snapshot of where buybacks stand. Each one is examined in greater detail later in the article.
- S&P 500 companies spent a record $293.5 billion on buybacks in Q1 2025.
- Q2 2025 spending fell 20.1% to $234.6 billion, then rose 6.2% to $249.0 billion in Q3.
- The 12-month total through September 2025 reached a record $1.020 trillion.
- The only earlier trillion-dollar 12-month period ended in June 2022, at $1.005 trillion.
- Buybacks totaled $942.6 billion in calendar 2024 and $519.8 billion in 2020.
- Apple spent $96.7 billion on repurchases in the 12 months through September 2025.
- Apple, Nvidia, Alphabet and Meta made up more than 22% of Q3 2025 buybacks.
- The top 20 companies made up 49.5% of Q3 2025 buybacks.
- Information technology made up 27.6% of 12-month buybacks, and financials made up 21.4%.
- Only 17.1% of S&P 500 companies cut their diluted share count by at least 4% in Q3 2025.
- U.S. public companies pay a 1% federal excise tax on net share repurchases.
The $1 Trillion Milestone
The trillion-dollar mark is the biggest headline. It was crossed during the 12 months ending September 2025, when buybacks rose 11.1% from the year before. It was only the second time the rolling annual total passed $1 trillion; the first was the 12 months ending June 2022, when companies spent $1.005 trillion.
Buyback spending at that scale rivals the yearly economic output of a medium-sized country, and few corporate activities reach that size.
One distinction matters when reading these figures: the Nvidia and GM numbers are company announcements, while the other totals reflect completed spending tracked by S&P. Mixing the two would give a misleading picture.
What Is a Stock Buyback?
A stock buyback occurs when a company purchases its own shares from investors. The company usually retires those shares, so fewer remain in circulation.
A simple example illustrates the mechanics. A company has 1 billion shares and earns $10 billion, so earnings per share (EPS) are $10. If it buys back and retires 100 million shares, 900 million remain. With the same profit, EPS rises to about $11.11.
The company did not earn more money; the same profit is simply split among fewer shares. That is one reason buybacks can raise EPS and may support a stock price. Shareholders who keep their shares own a larger slice of the business.
Companies choose buybacks for several reasons. They may have extra cash, believe their shares are priced low, or want to lift per-share results. The decision depends on management's view of the share price and on what else the cash could do.
Buybacks vs. Dividends: How Companies Return Cash
Companies return money to shareholders in two main ways: paying dividends or buying back shares. A dividend sends cash straight to shareholders, while a buyback uses company cash to purchase outstanding shares.
Buybacks are the more flexible instrument. Once a firm starts a regular dividend, investors expect it to continue, and a cut can signal trouble. Repurchases can be raised, lowered or paused with far less market reaction — one reason companies favor them when cash is plentiful.
Buybacks now outweigh dividends. In the 12 months ending September 2025, companies spent $1.020 trillion on buybacks and $664.9 billion on dividends, for a combined $1.685 trillion returned to shareholders. Buybacks accounted for about 61% of the total.
Dividends still matter. They give investors steady income, while buybacks reward those who hold on through a larger ownership share.
Quarterly Buyback Statistics: Q1 2025 Set a Record
The largest single quarter in S&P's published series was Q1 2025, at $293.45 billion, with strong earnings and cash flow helping push spending higher.
Companies then pulled back. Q2 spending dropped 20.1% to $234.57 billion, before rising 6.2% to $249.00 billion in Q3 — still above the $226.6 billion spent in Q3 2024.
The Q1 jump shows how fast spending can change. Buybacks respond quickly to profits, cash levels and market conditions. Q1 2025 was about 24% above Q1 2024, and momentum was already building: Q4 2024, at $243.2 billion, had been the strongest quarter of that year.
Across the seven quarters in the dataset, the average was about $246 billion, and only Q1 2025 sat far above that level.
Annual Buyback Statistics Since 2017
Long-term data shows a clear step up. Annual buybacks were about $519 billion in 2017 and reached about $943 billion in 2024.
Spending rose sharply after the 2017 U.S. corporate tax overhaul, hitting $806 billion in 2018. The pandemic then cut spending to $520 billion in 2020. Companies rebounded with $882 billion in 2021 and $923 billion in 2022, dipped to $795 billion in 2023, and set an annual record of $942.6 billion in calendar 2024. The rolling 12-month figure then passed $1 trillion during 2025.
Annual spending is up about 82% from 2017 to 2024. From 2021 to 2024, it stayed within a range of $795 billion to $943 billion — far above the pre-2018 level. The dips are also visible: 2019 spending was about 10% below 2018, and 2023 came in lower than 2022.
Buybacks Drop When Companies Protect Cash
Repurchases are cyclical and tend to fall hard when the economy weakens.
In Q4 2007, just before the financial crisis deepened, S&P 500 companies spent about $141.7 billion. By Q2 2009, quarterly spending had fallen to $24.2 billion — a drop of more than 80%, with Q2 2009 equal to roughly one-sixth of the Q4 2007 level. Companies chose to hold cash while credit markets were stressed, and few other corporate budgets fell that fast.
The same pattern appeared in 2020. Annual buybacks fell from $728.7 billion in 2019 to $519.8 billion in 2020, a decline of about 29%, then bounced back to almost $882 billion the next year. The record totals of recent years show how quickly companies return to buying when conditions improve.
Top Buyback Companies: Apple, Nvidia, Alphabet and Meta
A few firms drive the totals, and Apple has shaped modern buyback statistics more than any other company.
Apple spent about $20.4 billion on buybacks in Q3 2025 and $96.7 billion over the 12 months ending September 2025. Over five years, it spent about $468 billion; over ten years, the total was about $755 billion. Apple also held 19 of the 20 largest quarterly buyback spots in S&P's historical ranking at the time, with Meta holding the other one.
Nvidia is now a major buyer as well. It spent $14.9 billion in Q3 2025 and $51.8 billion over 12 months, up from $34.5 billion a year earlier — an increase of about 50%. Alphabet spent about $55.8 billion over 12 months, including $11.5 billion in Q3, while Meta spent $44.2 billion over 12 months and $8.5 billion in Q3.
Together, Apple, Nvidia, Alphabet and Meta spent $55.2 billion in Q3 2025 — more than 22% of all S&P 500 repurchases in the quarter. Apple's 12-month total was about 1.7 times Alphabet's, and its cash flow lets it invest in its business, pay dividends and retire shares at the same time.
Buyback Statistics by Sector
Technology gets the headlines, but financial firms are also large buyers. Together, the two sectors made up almost half of all spending.
Information technology spent $70.6 billion in Q3 2025, or 28.4% of the total, and $281.6 billion over 12 months, or 27.6%. Financial companies spent $65.3 billion in Q3 2025 — up 26.3% from the prior quarter and 48.2% from a year earlier — and about $218.6 billion over 12 months, of which JPMorgan alone spent $27.6 billion.
The trend continued in 2026. Goldman Sachs bought back about $4 billion of its shares in Q2 2026 and paid another $1.36 billion in dividends.
Technology and financials together spent $500.2 billion over 12 months, about 49% of the $1.020 trillion total. Communication services ranked third at $146.1 billion, while energy was the smallest of the seven sectors shown, at $59.4 billion.
Buybacks Are Concentrated in a Few Companies
Hundreds of companies buy back shares, but a small group does most of the spending. The top 20 repurchasers made up 49.5% of Q3 2025 buybacks. The historical average for the top 20 is about 47.8%, and before the pandemic it was lower, at around 44.5%.
This matters when reading trillion-dollar headlines: the average S&P 500 company is not spending billions each quarter.
Still, buybacks are widespread. In Q3 2025, 387 S&P 500 companies reported at least some repurchases, and 333 spent at least $5 million. Over the 12 months through September 2025, 436 companies bought back shares. Repurchases are a standard tool across corporate America, not only in Big Tech. Put differently, the top 20 firms spent about half of the total, and the rest of the index shared the other half.
Do Buybacks Reduce the Number of Shares?
Not always. A company can spend billions on buybacks without much change in its share count, because companies also issue new shares through employee pay, stock options, restricted stock units and acquisitions. Part of each buyback simply offsets that new issuance, so the dollars spent and the real drop in shares can be very different.
In Q3 2025, only 17.1% of S&P 500 companies cut their diluted share count — the number used in EPS calculations — by at least 4% year over year. When shares do fall, EPS rises even if profit is flat: if earnings grow 5% and shares fall 3%, EPS can rise about 8%. That can help a company meet per-share targets, and the effect is real, because remaining shareholders own more of the firm.
A useful review therefore looks at two numbers: the dollars spent and the actual drop in shares outstanding.
Price still matters. A buyback adds value when shares are bought below their worth. If a stock worth $100 is bought at $70, remaining holders gain, but buying at $150 can destroy value.
The 1% Buyback Tax and Its Effect
The Inflation Reduction Act added a federal excise tax on buybacks made after December 31, 2022. The tax is generally 1% of the fair market value of net repurchases by covered U.S. public companies.
S&P estimated the tax cost at about $2.25 billion in Q3 2025, cutting aggregate S&P 500 operating earnings by 0.36%. Over the 12 months ending September 2025, the effect was about 0.40% of operating earnings. S&P concluded the tax had not materially changed repurchasing behavior, and record spending since the tax took effect supports that view. Companies appear to treat it as a small cost.
The tax is based on net repurchases and is paid by the company, not by individual shareholders. At 1%, it is small next to the cost of the shares themselves: a $10 billion buyback would carry roughly $100 million in tax.
2026 Authorizations, the Buyback Index and AI Spending
New programs in 2026 show that large buybacks continue. Nvidia's board approved another $150 billion of repurchase capacity in September 2026, bringing its total available authorization to about $235 billion. Reports say this is larger than the market value of about 84% of S&P 500 companies, and the new approval itself represents about 64% of Nvidia's total available authorization.
General Motors announced a $20 billion program in October 2026, showing that buybacks matter outside Big Tech as well. GM's program is smaller, but it is large for a company outside the technology sector. These figures are authorizations, not completed purchases, and companies can spread them across many years.
S&P also runs the S&P 500 Buyback Index, which tracks the 100 S&P 500 stocks with the highest buyback ratios. As of August 2026, financials were about 30.1% of the index, consumer discretionary 17.4% and information technology 16.7%. Top holdings included Salesforce, Gartner, Workday, Newmont, Adobe, Airbnb and major refiners. Because the index ranks firms by buybacks relative to size, the biggest dollar spenders are not always on top.
One open question is AI spending. Tech firms are putting large sums into data centers, chips and power, yet many still run big buyback programs. Strong free cash flow lets firms like Nvidia, Apple, Alphabet and Meta do both for now. If AI costs keep rising, they could limit the cash left for repurchases.
The Bottom Line on Stock Buyback Statistics
Buybacks are a trillion-dollar part of U.S. markets. S&P 500 companies spent $942.6 billion in 2024, set a quarterly record of $293.5 billion in Q1 2025, and pushed rolling 12-month spending to $1.020 trillion by September 2025. Technology and financial firms made up almost half of it.
The activity is concentrated. Apple alone spent $96.7 billion over 12 months, and the top 20 firms made up 49.5% of Q3 2025 spending.
Headline numbers need care. A $100 billion authorization does not mean $100 billion was spent, and only 17.1% of companies cut diluted shares by at least 4%. A buyback is not automatically good or bad; its value depends on the price paid, the firm's finances and whether the cash could earn more elsewhere.
When reading buyback news, a few checks help separate headline size from real effect:
- Check whether the number is an authorization or completed spending.
- Look at the drop in share count, not only the dollars spent.
- Note how concentrated the spending is among a few firms.
- Consider the price paid compared with the value of the business.
- Review free cash flow, debt and other uses of cash, such as AI investment.
What is clear is the scale: trillion-dollar years may become common rather than rare.
Sources
- S&P Dow Jones Indices: S&P 500 Q3 2025 Buybacks
- S&P Dow Jones Indices: S&P 500 Buyback Index
- S&P Dow Jones Indices: Historical Buyback Data
- Internal Revenue Service: Publication 510
- IRS: Final Regulations on Corporate Stock Repurchases
- Reuters: Nvidia Adds $150 Billion to Share Repurchase Program
- Reuters: General Motors Announces $20 Billion Buyback
- Goldman Sachs: Q2 2026 Form 10-Q

