S&P 500 and Nasdaq Composite Technical Analysis: Broader Indices Mixed After Strong Jobs Report
Key Takeaways
- •US stocks traded mixed after a stronger-than-expected jobs report, with the S&P 500 marginally lower and the Nasdaq Composite posting a modest gain.
- •Dovish comments from Fed Governor Christopher Waller, an FOMC voting member, accelerated gains that carried both indices above their 100-hour moving averages this week.
- •The S&P 500 trades near 7,730.65, holding above its 100-hour moving average at 7,693.88, with resistance at the August swing highs between 7,771 and 7,816, the upper end being the all-time high.
- •The Nasdaq's first key support is its 100-hour moving average near 26,295.87, with major resistance between 26,707 and 26,875 and the all-time high at 27,190.21 as the next target if that zone breaks.
- •A strong labor market could prompt the Fed to keep rates higher or tighten further, which weighs especially on growth and technology stocks by raising borrowing costs and lowering the value of future earnings.
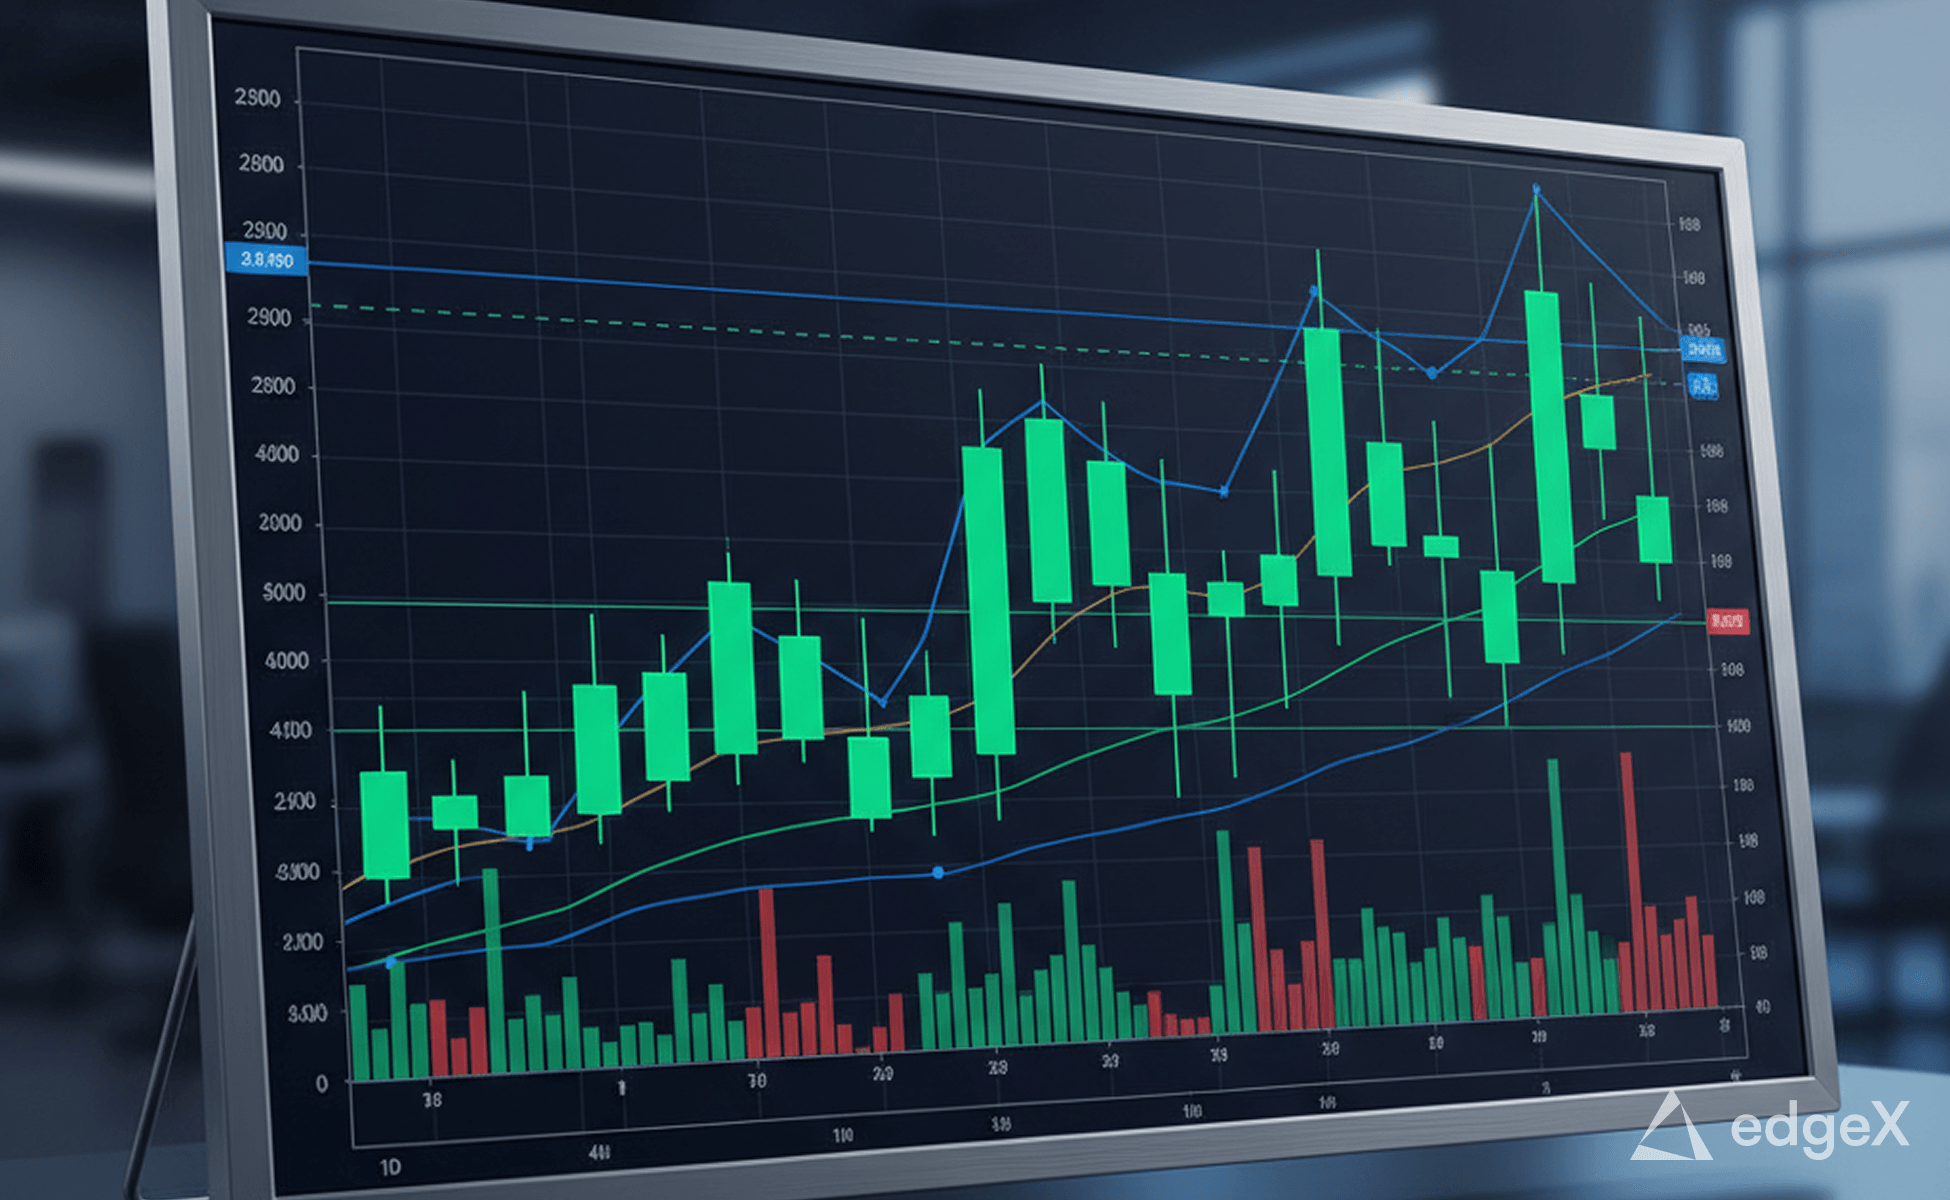
The broader US stock indices are trading mixed as investors digest a stronger-than-expected US jobs report. The S&P 500 is marginally lower, while the Nasdaq Composite is posting a modest gain. The reaction underscores a market that remains highly sensitive to labor market data, one of the Federal Reserve's most closely watched inputs for setting interest rate policy.
A strong employment report cuts both ways for equities. On the positive side, continued job growth supports consumer spending, economic activity and corporate earnings. On the negative side, a strong economy and a tight labor market can keep wage and inflation pressures elevated. That could lead the Federal Reserve to maintain higher interest rates—or even tighten policy further. Higher rates raise borrowing costs and can reduce the present value investors are willing to pay for future corporate earnings, particularly for growth and technology companies, which is why rate expectations tend to weigh most heavily on the tech-heavy Nasdaq.
When the fundamental picture sends mixed signals, technical levels take on added importance. Moving averages and prior swing levels help traders define three things: the market's directional bias, where risk can be limited, and where the next price targets lie.
This week, both indices moved higher, with gains accelerating yesterday after more dovish comments from Fed Governor Christopher Waller. Waller is a voting member of the Federal Open Market Committee, and his remarks carry weight with traders trying to gauge the direction of the next policy move. Those advances carried both indices above their respective 100-hour moving averages, shifting the short-term technical bias more firmly in the buyers' favor.
For the S&P 500, the price moved above its 100-hour moving average at 7,693.88 and is currently trading near 7,730.65. As long as the index remains above that moving average, buyers retain more control in the short term. It would take a move back below the 100-hour moving average—and then below the 200-hour moving average at 7,665.09—to tilt the short-term bias back to the downside. The two moving averages therefore provide a technical roadmap: staying above them keeps the bullish bias intact, while breaking below both would signal that buyers are losing control.
On the topside, resistance comes against the August swing highs between 7,771 and 7,816, with 7,816 representing the all-time high. Swing highs often attract profit-taking because traders remember those previous price extremes. A sustained move above that area would represent another bullish technical break and open the door to new record highs.
For the Nasdaq Composite, the price also moved above its 100-hour moving average following Waller's comments. That moving average currently sits near 26,295.87 and remains the first important support level. On the topside, the August swing highs between 26,707 and 26,875 are the next major targets. The Nasdaq must get above—and stay above—that resistance area to strengthen the bullish bias. If it can do that, the all-time high at 27,190.21 would become the next major objective.
Conversely, a move below the 100-hour moving average at 26,295.87 would weaken the bullish momentum. A further break below the 200-hour moving average at 26,161.20 would shift the short-term bias more decisively toward the sellers.
The technical message is straightforward: buyers currently have the advantage in both indices because prices remain above their key hourly moving averages. However, the August highs still need to be broken to unlock the next leg higher. Until then, traders can use the moving averages below and the swing highs above to define the battlefield, manage risk, and identify the next directional break. Further Fed commentary and upcoming economic releases will likely determine whether those levels hold or give way.
