Solana Spot Volume Flips to “Heating” for the First Time as SOL Price Falls
Key Takeaways
- •Solana's spot volume has entered a "heating" state for the first time in about six months, with roughly half a dozen red bubbles printing as SOL fell from around $112 to near $103.
- •From December through early June, spot volume stayed mostly in cooling mode while SOL slid from about $150 to the low $80s, and the June low near $62 printed neutral without a volume climax.
- •Because bubble colors reflect volume intensity relative to a baseline rather than direction, heating activity against a falling price suggests active selling instead of a quiet drift.
- •Analyst Iko | Web3 identified $100 as the key zone to watch, saying a hold could give buyers another shot at recovery while a loss of that level could let sellers take control.
- •If volume returns to neutral or cooling while price holds near $100, selling would be fading, whereas persistent heating alongside a break of $100 would confirm the decline.
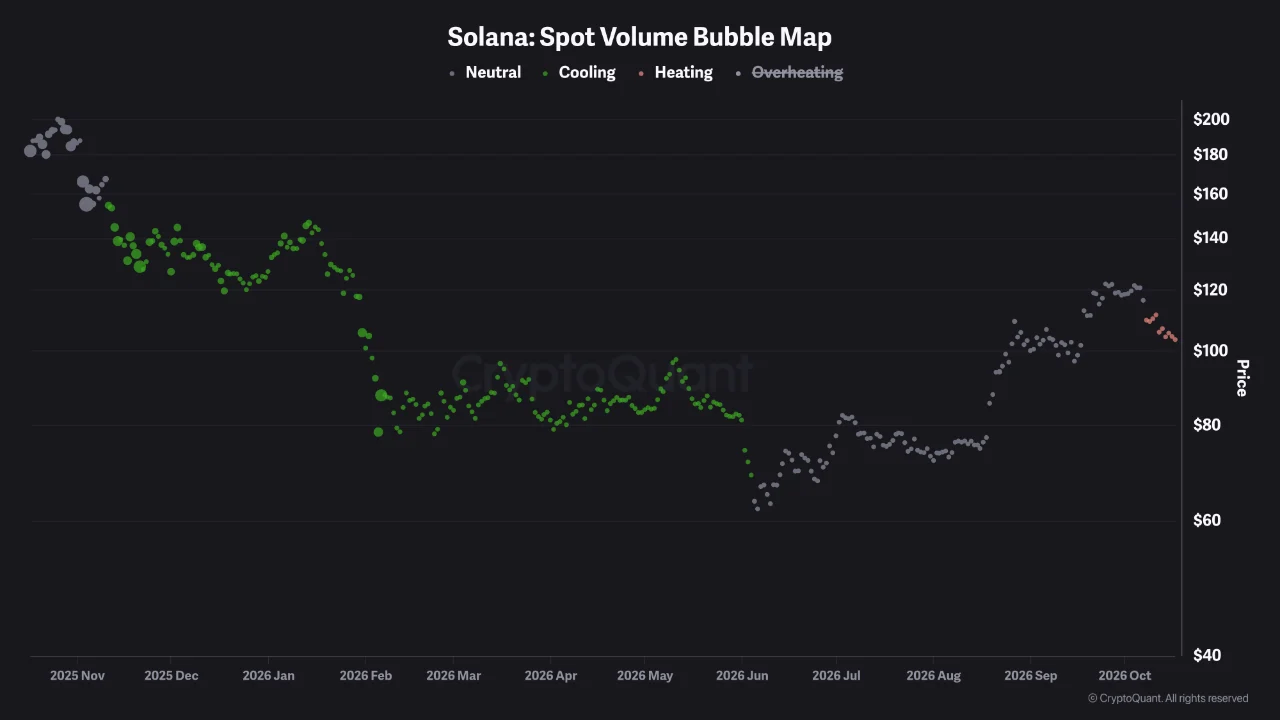
Solana’s spot volume has flipped into a “heating” state for the first time in roughly six months, and the shift is taking place while the price falls. A bubble map of daily spot volume, sourced from CryptoQuant, shows the first red readings after a period dominated by cooling volume, with SOL, the native asset of the Solana network, down from about $120 in early October to near $103.
How the Bubble Map Works
The chart plots each day’s spot volume state against price. Spot volume measures trades in the asset itself on exchanges, as distinct from derivatives activity, and it is often watched as a gauge of participation in the underlying market. Every bubble is colored relative to its own baseline: heating means volume is running above that baseline, while green marks cooling volume. The color reflects intensity relative to the baseline only — it does not indicate direction, and it does not show whether buyers or sellers generated the activity.
Six Months of Cooling Volume
From December through early June, nearly every bubble on the chart was green, marking cooling volume against the baseline. Over that stretch, SOL slid from about $150 to the low $80s.
Price drifted lower without any rise in volume, and no spike in activity appeared along the way. The pattern matches a quiet bleed rather than a panic: Solana spot volume stayed muted, participation faded, and the decline continued.
The June low near $62 did not follow that script. Bubbles at that level turned neutral instead of heating, which means the bottom printed no volume climax. Neutral readings then held through the recovery that carried SOL back to roughly $120 in early October.
First Red Bubbles Appear as Price Falls
The first red bubbles on the chart have now appeared. About half a dozen printed as SOL fell from roughly $112 to $103, and until that point no heating readings had shown up in the window displayed. The readings mark a clear break from the pattern established over the prior six months.
Color only signals that volume is running hotter than its baseline; it does not show direction. Even so, heating volume against a falling price points to active selling rather than drift. Neutral and cooling bubbles dominated all earlier readings on the chart.
This tape differs from the one that dominated the first half of the year. Then, price declined while volume cooled. Now, Solana spot volume is expanding as price moves lower.
The $100 Level Frames the Next Move
Analyst Iko | Web3 offered a related view in an X post published on October 18. According to the post, SOL ran toward $120 but now trades near $103, and the analyst described $100 as the key zone to watch. Holding that level could give buyers another shot at recovery, while losing it could allow sellers to take control. The post also raised the question of whether buyers can defend their gains after the rally.
$SOL bulls have a decision to make. Solana ran toward $120, but now the price is back near $103. Here’s the level that matters most → $100 is the key zone to watch. → Hold it, and buyers may get another shot at recovery. → Lose it, and sellers could take control. The… pic.twitter.com/majLJUzIXR
— Iko | Web3 (@IkoWEB3) October 18, 2026
The Solana spot volume chart offers a way to track how that level plays out. If bubbles return to neutral or cooling while the price holds near $100, selling is fading, and the move would read as a pullback.
The alternative scenario looks different. If heating persists and $100 breaks, volume would confirm the decline. The two readings point to opposite interpretations of the same price action. The overheating state is struck through in the legend, so the chart does not display it; a move into that state would be the stress signal.
Until one of those outcomes plays out, the $100 area remains the level to watch.
The post Solana Spot Volume Flips to “Heating” or the First Time as SOL Price Falls first appeared on Blockonomi.

