Solana's RSI Falls Below 30, Flashing a Signal Last Seen at the $60 Bottom
Key Takeaways
- •Solana's 14-day RSI fell to 27.6, marking its first oversold reading below 30 since June, when a similar signal preceded a rally from roughly $60 to $125.
- •SOL broke below the 100-day moving average at $98 and the 0.382 Fibonacci level near $100 before finding support at $92.34, just one cent above the 0.500 Fibonacci level.
- •Friday's slide retraced 50% of the approximately $65 rally from the June low near $60 to the cycle peak near $125, on volume of 2.74 million SOL worth about $258 million.
- •Despite the short-term damage, Solana's moving averages remain in bullish order, with the token trading between the 100-day SMA at $98 and a rising 200-day SMA at $89.
- •A daily close back above $100 would neutralize the breakdown and open the way to the 50-day SMA at $109, while a decisive close below $92 could target the 200-day SMA at $89 and the 0.618 Fibonacci level near $85.
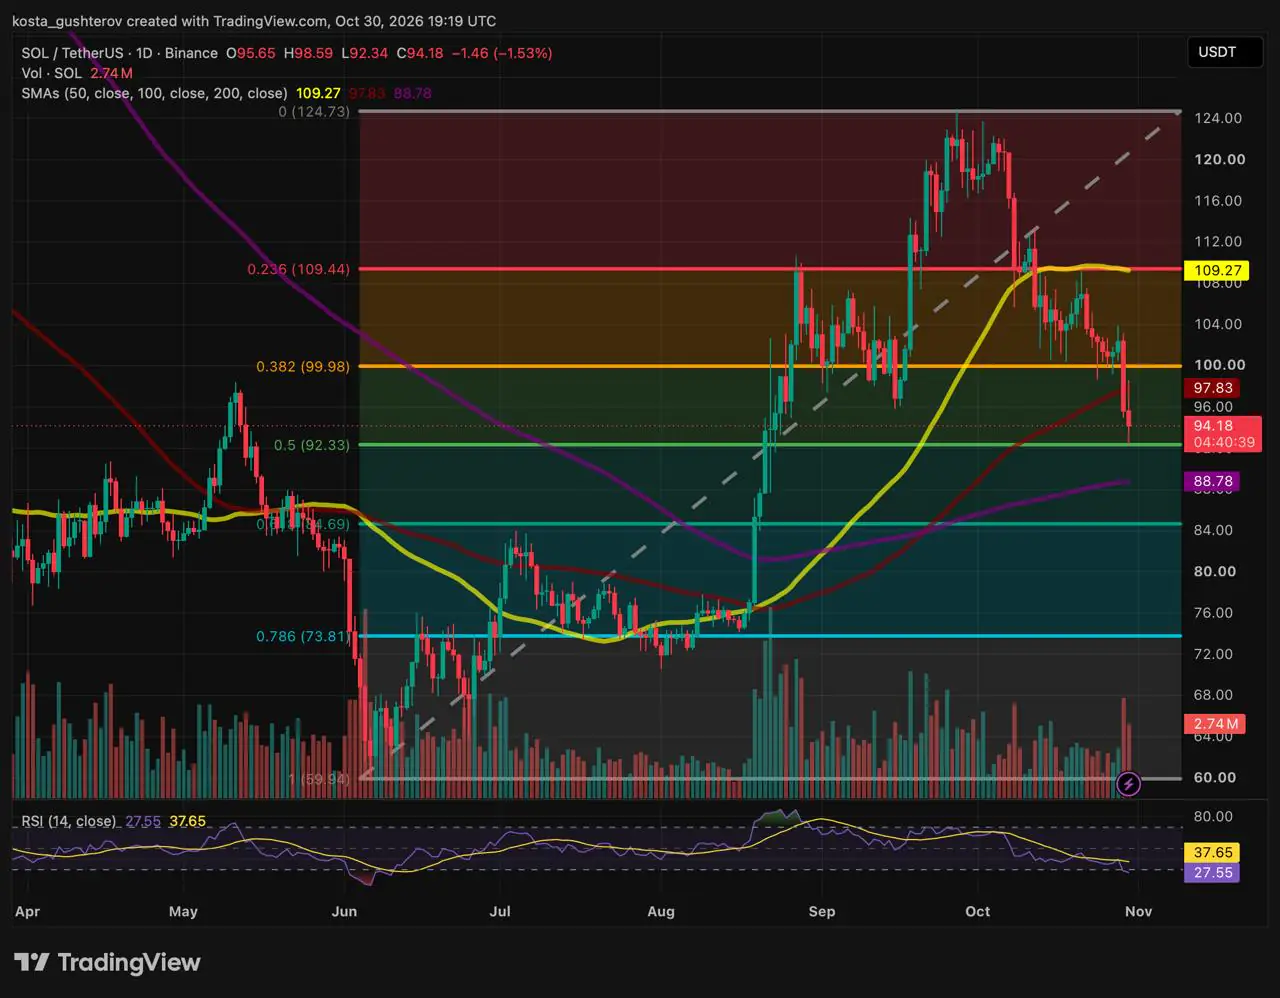
Solana (SOL), the native token of the Solana smart-contract blockchain, traded at $94 at 19:19 UTC on Friday, down about 1.5% on the day, according to the Binance SOL/USDT daily chart analyzed by Coindoo. The move pushed the token's 14-day Relative Strength Index (RSI) to 27.6 — its first reading below 30 since June, when the indicator last turned oversold just before SOL bottomed near $60 and launched a rally that carried it to $125.
The Signal: RSI Below 30
The RSI measures the strength of recent gains against recent losses on a scale from 0 to 100. Readings below 30 are conventionally described as oversold, meaning sellers have been in control to an unusual degree. The indicator is one of the most widely followed momentum gauges in technical analysis, applied to assets from stock indices to cryptocurrencies.
Solana's 14-day RSI has now dropped to 27.6, roughly 10 points below its yellow signal line at 37.7. On this chart, the only other occasion the indicator fell under 30 came in mid-June, immediately before SOL printed its low near $60 and began the advance to $125.
A single prior instance is not a pattern, and an oversold reading can persist for days. What the signal does establish is that selling pressure is now as stretched as it was at the start of the summer rally.
Where the Sell-Off Stopped: One Cent
The oversold reading arrived on a sharp two-day slide. After several days of pressure against the 0.382 Fibonacci level near $100, a heavy red candle cut through that line and through the red 100-day simple moving average (SMA) — the average of the past 100 daily closes — at $98, closing at $96. The next candle opened there and wicked up to $99, testing the underside of both broken levels. Sellers rejected the probe, and price fell directly to the next line on the grid — the 0.500 Fibonacci level near $92. The session's low printed at $92.34, one cent above the $92.33 level, before buyers stepped in.
Volume accompanied the move: Friday's session has traded 2.74 million SOL, approximately $258 million at current prices.
Half the Rally, Handed Back
The Fibonacci grid on the chart measures the rally from the June low near $60 (the 1.0 level) to the cycle peak near $125 (the 0 level) — a move of about $65. Fibonacci retracements plot standard ratios of a prior move and are widely watched by chartists as potential support and resistance zones. At Friday's low, Solana had returned exactly half of it and sat roughly 26% below the peak.
That is what makes the timing of the signal stand out. The last time RSI dropped below 30, SOL was at the very bottom of that $65 move. This time the reading arrives at the halfway point, with the 50% pullback erasing the excess of the September run but not the move that came before it.
Three Averages, One Order
SOL now trades in the corridor between its red 100-day SMA at $98 above and its rising purple 200-day SMA at $89 below. The averages remain stacked in bullish order — the 50-day above the 100-day, and the 100-day above the 200-day — so the long-term trend has not flipped despite the short-term damage. In June, the same oversold reading came with the averages arranged the opposite way.
Three things now converge: an RSI below 30, a low printed one cent above the 0.500 level, and the 200-day SMA sitting close underneath. Together they give buyers a case for a relief bounce or a period of base-building, while the broken 100-day SMA and the $100 mark form a heavy ceiling overhead.
The Level Book
Laid out like an order book, resistance sits above the current price at the 100-day SMA near $98, the 0.382 Fibonacci level at roughly $100, and the 50-day SMA at $109. Support lies below at the 0.500 Fibonacci level near $92, the rising 200-day SMA at $89, and the 0.618 Fibonacci level around $85.
What Would Settle It
An oversold signal is a starting point, not a verdict. The daily closes will decide which way this goes.
For a bounce, buyers would need to keep defending the 0.500 level near $92 through the daily close, with the oversold RSI drawing in short covering. A relief push back into the $98–$100 band — where the 100-day SMA and the 0.382 Fibonacci level sit — would come next, and a daily close back above $100 would neutralize the breakdown and reopen the way to the 50-day SMA at $109.
A breakdown, by contrast, would involve a decisive daily close below the 0.500 level near $92, undoing Friday's bounce, alongside an RSI that stays under 30 — a sign that oversold conditions can stretch further. Price would then target the rising 200-day SMA at $89 first, followed by the 0.618 Fibonacci level around $85, roughly 10% below the current price.
Trend Check
The last time this signal flashed, Solana was sitting near $60. This time it appears 57% higher, above a rising 200-day average and with its moving averages in bullish order. The short-term picture changed when $100 broke. The long-term one changes only if the 200-day SMA and the golden pocket give way.
This article is provided for informational purposes only and does not constitute financial or investment advice. Technical levels and scenarios do not guarantee future price movement.

