Solana Holds Above $110 as Analysts Map Path Toward $133 Resistance
Key Takeaways
- •Solana traded near $114.48 on Sept. 24, up approximately 16.3% over seven days, with a weekly high of $119.90 and a market capitalization of $68.89 billion.
- •The immediate technical barrier is the $120.80 Fibonacci extension, and a sustained break above it would bring the $127.72 extension and the $133 resistance target into focus.
- •Near-term support levels are identified at $111.06 and $107.40, and a move beneath them would weaken the short-term structure built during the latest rally.
- •SOL recovered from a June low near the low-$60 range and formed a higher high above its previous May peak, though a broader trend reversal requires confirmation through a higher low.
- •Analyst Crypto Patel maintains long-term Solana targets of $500 and $1,000, based on a chart that tracks an accumulation zone of $60 to $67.
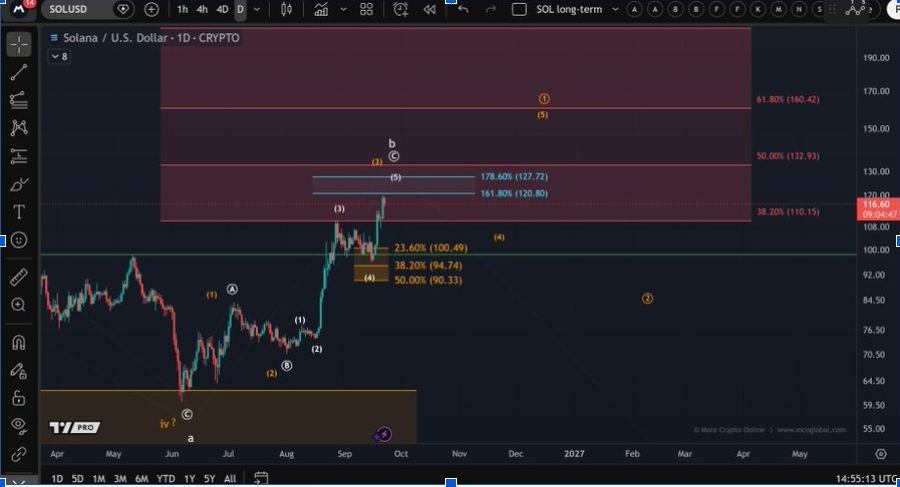
Solana (SOL) held above $110 on Sept. 24 after a sharp September recovery carried the token close to the $120 area, with technical analysts mapping out a sequence of upside levels toward $133. Data from CoinGecko showed SOL trading near $114.48, up about 16.3% over seven days, its seven-day high stood at $119.90. That leaves the charted $120.80 Fibonacci extension as the immediate technical level for the market to clear.
The underlying analysis, published by The Market Periodical, draws on chart breakdowns shared by the analysts More Crypto Online and Crypto Patel on X.
The supplied technical charts identify $111.06 and $107.40 as nearby support levels. Above $120.80, the same framework places the next upside references around $127.72 and $132.93, the latter closely matching a $133 resistance target.
SOL Defends the $110 Breakout Zone
SOL traded at $115 in the latest data, leaving the token up 19% over the previous week. The move followed a steady recovery from below $100, during which SOL cleared $105 and $110 before advancing toward the $120 area. Market capitalization reached $68.89 billion, while 24-hour trading volume stood at $5.2 billion.
Analyst More Crypto Online shared the breakdown on X (post) and places $110.15 at the 38.2% Fibonacci level. Fibonacci retracements and extensions are widely used technical reference points, drawn from fixed ratios of a prior price swing, that traders monitor to gauge potential support and resistance zones. SOL has remained above that area since the breakout, keeping the recent higher structure intact. The same chart marks $100.49 at the 23.6% retracement, while lower Fibonacci levels sit near $90.33.
Those levels give the market several reference points if buyers lose control of the $110 region. As long as price holds the breakout area, attention stays on the upper extensions rather than the deeper retracement zones.
The $120.80 Fibonacci Extension Sets the Next Test
The next technical barrier sits at $120.80, which marks the 161.8% Fibonacci extension on the daily chart. More Crypto Online identified the level as an important extension within the current wave structure. SOL recently reached that zone but has yet to establish a confirmed break above it.
A sustained move through $120.80 would bring $127.72 into focus, a level representing the 178.6% extension on the same chart. The next major area sits around $132.93, closely matching the analyst's $133 resistance target. The chart also places another broader Fibonacci level near $160.42, though that reference becomes relevant only after SOL clears the $120.80, $127.72 and $133 zones. This keeps the $120.80 breakout as the immediate technical test.
Short-Term Supports Take On Added Weight
Near-term support now carries more weight following September's advance. The analysis identifies $111.06 as the closest support, with $107.40 sitting just below the recent breakout. A move beneath those areas would weaken the short-term sequence that developed during the latest rally.
The wider daily chart shows SOL recovering from a June low around the low-$60 range. The token climbed through July and August before accelerating in September, and that recovery eventually pushed SOL above its previous May high, creating a higher high on the daily structure.
Even so, the analyst has not confirmed a broader trend reversal. In market-structure analysis, forming a higher low after an advance is a standard confirmation step, and the framework requires SOL to complete it before a more durable change in market structure can be confirmed.
Long-Term Outlook Maps $1,000
Crypto Patel's longer-term chart, shared on X (post), begins with an accumulation area around $60 to $67 and tracks the subsequent move toward $120, representing roughly a doubling from the cited accumulation zone. Patel maintains long-term Solana targets of $500 and $1,000 based on the broader technical structure.
The long-term chart also identifies a support and entry region extending through the lower price range, while its mid-range Fibonacci area sits near $32.53. Those levels belong to a wider market-cycle setup rather than the current short-term move, leaving the nearer technical levels more relevant to the present structure.
For the current setup, SOL must first deal with the $120.80 Fibonacci extension before $127.72 and the $133 resistance area can enter the next stage of the price outlook.
This article is for informational purposes only and does not constitute financial or investment advice. Fibonacci levels and analyst price targets do not guarantee future market performance.
Source: The Market Periodical, Sept. 24, 2026.

