Solana Price Bounces Off $89, but the Clock Is Ticking
Key Takeaways
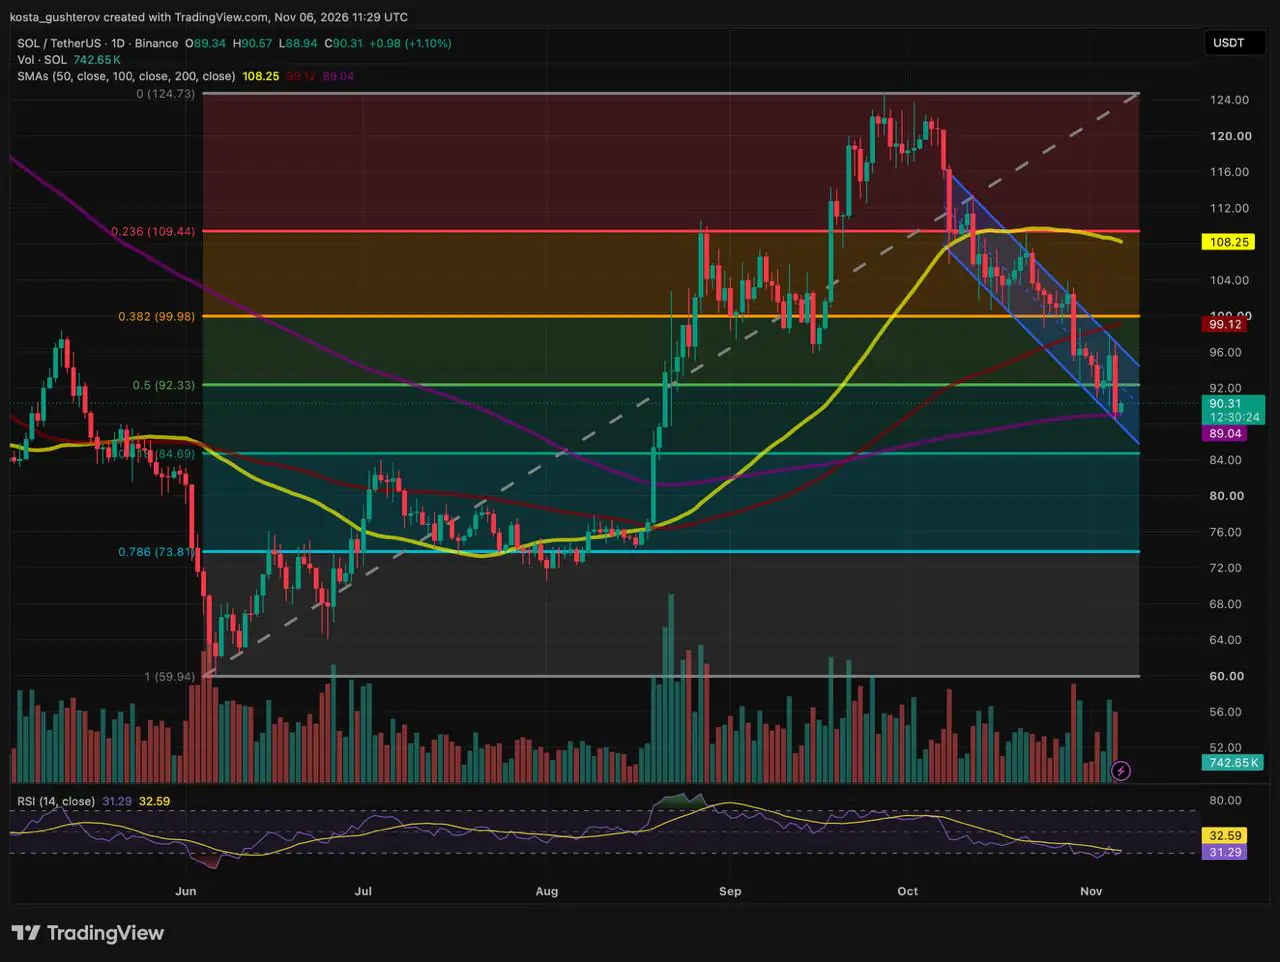
- •SOL's rebound stalled near $96 before a November 5 red candle drove the price back to close just above the 200-day SMA at $89, a level held since the August breakout.
- •The channel's lower rail and the rising 200-day SMA currently overlap near $89, but the two lines will separate within days as the rail slopes lower and the average edges higher.
- •The 14-day RSI reads 31.29, just above the oversold line and above its October 30 low of 27.55, setting up a possible early bullish divergence if the reading holds into the close.
- •With roughly 743,000 SOL traded by mid-session, volume has not yet shown whether buyers matched the selling behind the November 5 candle.
- •The medium-term trend remains downward, with the 50-day SMA bending lower at $108, while the 0.618 retracement near $85 and the 0.786 retracement near $74 sit as potential downside levels.
At a Glance
- SOL was rejected near $96 earlier this week
- The November 5 candle closed just above the 200-day SMA
- RSI reads 31.29, versus 27.55 on October 30
- The 0.618 retracement near $85 sits below
Late-October Low Gives Way
Solana's October 30 dip, which came the day after the record Binance hack — a US$6.3 billion hack that drove a spike in withdrawals before the exchange came back online — set the late-October low that this week's sell-off has now undercut. Since early October, the pullback from that peak has traded inside a descending channel, and the October 30 dip ended at the channel's lower rail, close to the 0.5 retracement around $92.
Buyers used that low to push SOL back toward the upper rail early this week, but the advance stalled near $96. On November 5, a wide red candle unwound the rebound, cut back through the $92 area and closed just above the 200-day SMA at $89 — a level SOL has held since its August breakout. Today's session opened near $89, dipped briefly below the average and recovered to an intraday high near $91. At the time of the chart, with roughly half the session remaining, SOL traded around $90, up $1, or 1.1%.
Why the Sell-Off Stopped Here, and for How Long
On its own, losing the 0.5 retracement looks bearish. The channel explains why sellers ran out of room at $89: its lower rail marks how far the downtrend has stretched in the short term, and each downleg inside the channel has ended near that line. This week the rail ran into the rising 200-day SMA, putting a channel floor and a long-term trend average on top of each other.
That overlap will not last. The rail slopes lower with every session while the 200-day SMA edges higher, so the two lines separate within days. For now, the zone around $89 is the strongest base the channel has offered for a mean-reversion bounce, but the setup has a short shelf life.
What Momentum Shows So Far
The 14-day RSI reads 31.29, just above the 30 oversold line and 1.30 points under its signal line at 32.59. On October 30, it fell to 27.55. If today's close keeps the RSI above that level after a lower price low, SOL would show an early bullish divergence at the channel floor. Until the candle closes, the reading can still change.
Volume offers no verdict yet. Roughly 743,000 SOL had traded with half the session left, and the close will show whether buyers matched the selling behind the November 5 candle.
The $89 Ladder
Where today's candle settles against the 200-day SMA decides which way the ladder moves.
Climbing out. A move out of the channel runs into the still-rising 100-day SMA, tucked just beneath the 0.382 retracement and the round number. A daily close back over the midpoint puts the upper channel rail on the table. The first obstacle for any rebound is the 0.5 retracement, the halfway mark of the rally that began in June and former support that now pushes back from above; the 200-day SMA and the lower rail share this level today. The climb starts if buyers carry SOL above the average into the close, volume stands up to the November 5 sell-off and the RSI crosses back over its signal line.
Slipping through. A daily close under the average strips away the first support, though the sinking rail may still sit below price at that point. A second close beneath the channel floor erases the double-support setup. The 0.618 retracement, roughly 6% below the current price, is the shelf that capped July and August trading until the August breakout.
Still True Either Way
Any rebound remains a move inside a falling channel, and the 50-day SMA bending lower at $108, just beneath the 0.236 retracement near $109, keeps the medium-term trend pointed down. Below the $85 area, the 0.786 retracement near $74 marks the July–August base, with the June origin of the rally beneath it.

