Solana Breaks Down to $82 as Fed Rate-Hike Odds Near 100%
Key Takeaways
- •Solana's breakdown followed an October CPI report that exceeded forecasts, leaving FedWatch pricing zero probability of a hold at the December 9 meeting and 11-15% odds of a larger half-point hike.
- •Exchanges liquidated $36.52 million in SOL positions over 24 hours, with 97.3% of that total coming from leveraged long traders, while open interest slid to $5.14 billion, down about 15% since mid-September.
- •A four-hour close beneath $81.34 would point toward downside extensions at $78.68 and $76.03, whereas any recovery must first clear $84 to re-enter the channel en route to $86.65.
- •SOL recorded its first daily close below the 200-day simple moving average since August on November 8, and the four-hour RSI has fallen to roughly 26.8, signaling persistent seller control.
- •Formation Securities notified the SEC on November 9 of its intent to operate a tokenized securities venue on Solana, expecting Exodus Movement, Forward Industries, and Galaxy Digital as initial listings when it launches in early 2027.
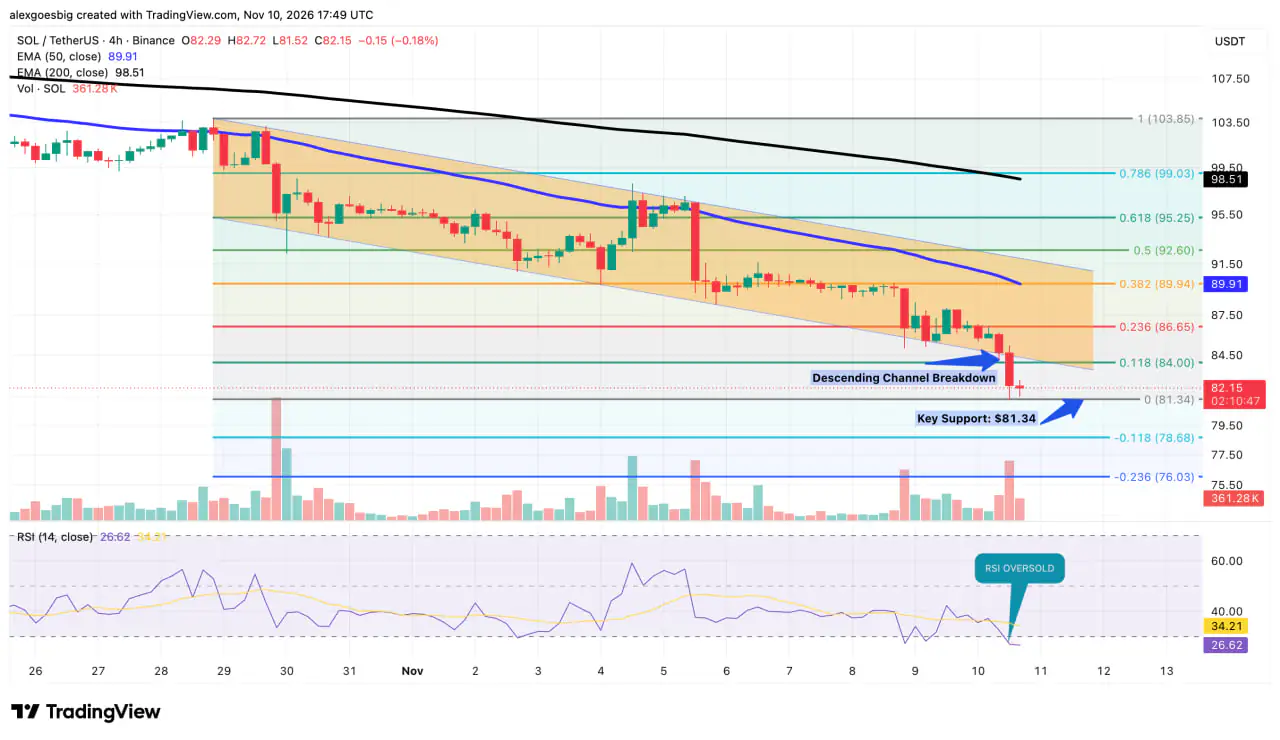
Solana (SOL) slid to around $82 on Tuesday, November 10, dropping out of the descending channel — a pattern of steadily lower highs and lower lows — that had framed its price since October 29. The break followed a hotter-than-expected U.S. inflation report that removed any remaining chance of the Federal Reserve holding rates steady at its December meeting, pushing Bitcoin, the largest cryptocurrency by market value, below $73,000 and dragging most altcoins lower with it.
SOL ended the day down 5% and the week down nearly 12%, leaving its market capitalization at $48.6 billion. CME's FedWatch tool, which translates fed funds futures pricing into implied rate odds, now shows no probability of a hold at the December 9 meeting, and traders put the odds of a larger half-point hike at between 11% and 15%.
Monday's Support Test Ends in a Breakdown
The four-hour breakdown extends a decline that started on the daily chart. On November 8, SOL posted its first daily close below the 200-day simple moving average — a long-term trend gauge many traders treat as the dividing line between bull and bear phases — since August. The rebound that followed stalled at $88.46, just under the average near $89. As noted in a November 9 analysis, that rejection shifted attention to the $84.70 area, where the daily chart's 0.618 Fibonacci retracement — one of the fixed-ratio levels traders plot against a prior price swing — was converging with the lower edge of the channel.
That zone held for less than a day. Sellers pushed SOL through $84 and out of the channel on a sharp jump in four-hour volume, and the session low of $81.52 came within a few cents of the next support. On Monday, the open question was whether former support would hold; by Tuesday, the chart pointed to a possible continuation of the downtrend, with traders caring less about reclaiming $89 than about whether buyers can defend $81.34.
Another Leg Down Would Open the Door to $76
The $81.34 level is the base of the Fibonacci retracement drawn from the $103.85 high where the channel began, which makes it the last reference point inside the range SOL has traded in for two weeks. A four-hour close beneath it would expose the first downside extension at $78.68, and further selling would bring $76.03 into view.
Above the price, $84 has changed roles. It was the floor that kept the channel intact, and any rebound must now clear it first. A move back above $84 would return SOL to the channel, with $86.65 as the next ceiling, although the broader downtrend would remain in place. The 50-period exponential moving average at $89.91 and the 200-period EMA at $98.51 both sit well overhead, and the first of them lines up almost exactly with the 0.382 retracement at $89.94.
The four-hour relative strength index, a momentum gauge scaled from 0 to 100, has dropped to about 26.8, a reading that means sellers have controlled almost every four-hour session for the past two and a half days. Selling at that pace often burns itself out and leads to a short relief bounce, but readings like this rarely mark the actual low, and the indicator's own average at 34.2 is still falling.
Leveraged Longs Absorbed 97% of the Liquidations
According to CoinGlass data, exchanges liquidated $36.52 million in SOL positions over 24 hours, and $35.54 million of that — 97.3% — came from long traders who had borrowed to bet on higher prices. When a long position runs out of margin, the exchange closes it by selling the collateral into the market, adding supply just as buyers thin out. That forced selling helps explain how SOL cut through $84 in a single four-hour candle.
Open interest, the total value of outstanding futures contracts, points the same way. It stood at $5.14 billion on November 10, down about 15% since mid-September and roughly a third below the $7.8 billion peak on September 27. When price and open interest fall together, traders are usually closing positions, whether by choice or by force, so the decline appears driven more by longs leaving than by new short bets. The washout is not complete yet, because open interest still sits in the 67th percentile of the past year — above roughly two-thirds of the past year's readings — leaving enough leverage in the market to feed another cascade if $81.34 gives way.
The macro trigger matters because leverage reacts to interest rates. The Fed held its target range at 3.75% to 4.00% on October 28, and FedWatch had already priced a quarter-point December hike above 80% after that meeting. The October consumer price index, the government's main inflation gauge, pushed those odds to near-certainty on Tuesday, after prices rose 0.4% for the month against expectations of 0.3%, while core inflation, which excludes food and energy, rose 0.3% against a forecast of 0.2%. A hike raises the expected cost of borrowing dollars, which tends to support the currency and draw capital away from assets that pay no yield, crypto included.
Formation Securities Picks Solana for Tokenized Stocks
The sell-off overshadowed a separate development for the network. On November 9, Formation Securities notified the SEC of its intent to operate a tokenized securities venue on Solana, where verified investors could trade blockchain versions of U.S.-listed shares around the clock — a contrast with the fixed weekday sessions of traditional exchanges — while keeping their voting and dividend rights, according to the announcement. The venue would use Orca's automated market maker, a system that prices trades from pools of deposited assets, and would settle each trade and its payment in a single on-chain transaction. Formation expects Exodus Movement, Forward Industries and Galaxy Digital to be the first listings when it launches in early 2027.
Formation filed the notice under the SEC's Innovation Exemption from September 17, and the regulator notes that appearing on its list of prospective venues does not establish compliance. The exemption also caps trading at 0.25% or 2.5% of a stock's average daily volume, depending on the tier. Any direct boost to SOL demand would therefore build slowly, through transaction fees — which may explain why the announcement did little to slow the sell-off.
BREAKING: Formation Securities ( @formation_so ) notifies the SEC of its intent to operate the first tokenized securities venue on Solana. U.S.-listed shares with the same voting and dividend rights as the originals, settling atomically onchain, 24/7. pic.twitter.com/SO4Jbnz4ci
What Traders Will Watch Before December 9
The near-term picture comes down to a handful of levels. A four-hour close below $81.34 would confirm the channel breakdown and point toward $78.68, while a recovery above $84 would reopen the path to $86.65. Open interest is the second signal to track, because a rise during a bounce would mean new leveraged longs are returning and rebuilding the fuel for another liquidation wave, while a rebound on flat or falling open interest would point to buyers paying in full with their own funds instead of borrowed money.
Beyond the chart, the Fed's December 9 decision is now the main event on the macro calendar, and the dot plot — the Fed's chart of each policymaker's projected rate path — released alongside it will show how many further hikes policymakers expect in 2027. Over the next four weeks, how markets price that path may matter more for SOL than any single technical level, because it sets how much borrowed money traders are willing to keep in crypto positions.
This article originally appeared on Coindoo.

