Grok AI Forecasts Solana at $250–$350 by End of 2026 Amid Institutional and Technical Shifts
Key Takeaways
- •Firedancer, Alpenglow, Agave 4.2, and larger compute unit blocks are cited as upgrades that could expand Solana’s capacity and speed.
- •Spot SOL ETFs have been live since late 2025 and have gathered about $1.12 billion in cumulative inflows, while Morgan Stanley has launched a staking product on the network.
- •Solana’s real-world asset tokenization has surpassed $3.7 billion, and the chain now accounts for more than 95% of tokenized equities volume.
- •The network’s expansion is also supported by stablecoin, payments, DeFi, DEX, and AI-agent integrations, along with governance changes that tighten supply.
- •SOL recently traded around $76.19, with resistance at $80, $90, and $100, while a bearish scenario could put the token in the $40 to $65 range if key catalysts weaken.
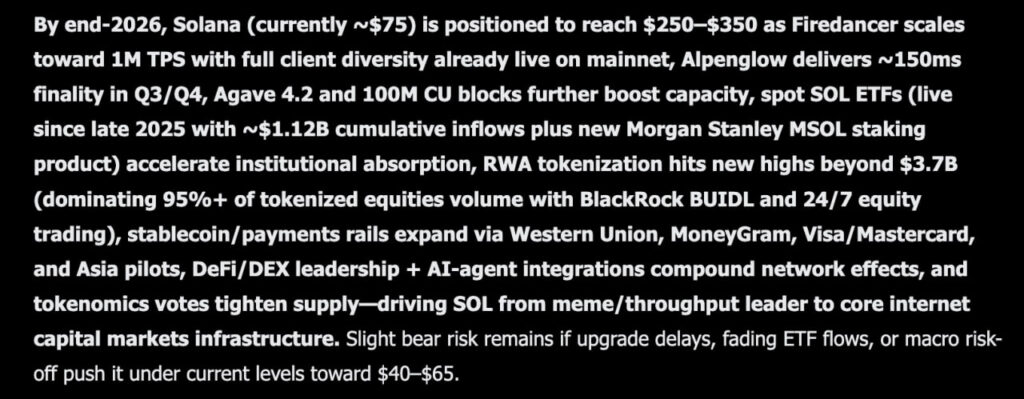
A significant transformation is taking place on Solana as the network moves beyond its reputation as a hub for memecoins and begins settling tokenized equities. According to a Grok AI prediction, that transition is already underway, with a projected price target of $250 to $350 for SOL by the end of 2026, up from its current level of approximately $75.
Technical Upgrades Underpinning the Thesis
The technical case centers on several key upgrades. Firedancer is scaling toward 1 million transactions per second (TPS), with full client diversity already live on mainnet. The Alpenglow upgrade is expected to deliver approximately 150ms finality in Q3 or Q4. Additionally, Agave 4.2 and 100M compute unit (CU) blocks will further push network capacity.
These upgrades matter because they speak to whether Solana can handle heavier activity without losing the speed and lower-cost profile that has helped it attract developers and traders. In practice, execution capacity and finality are the kinds of infrastructure details that determine whether new financial products can run reliably at scale.
Institutional Adoption and Tokenization Growth
Institutional absorption is accelerating through spot SOL ETFs, which have been live since late 2025 and accumulated approximately $1.12 billion in cumulative inflows. A new Morgan Stanley staking product has also launched on the network.
Real-world asset (RWA) tokenization on Solana has surpassed $3.7 billion and continues to climb. Solana now accounts for more than 95% of tokenized equities volume, with BlackRock's BUIDL fund and 24/7 equity trading operating on the chain.
Stablecoin and payments infrastructure is expanding through partnerships with Western Union, MoneyGram, Visa, Mastercard, and pilots across Asia. DeFi and decentralized exchange (DEX) leadership, combined with AI-agent integrations, further compound these network effects. Tokenomics governance votes are also tightening supply.
Taken together, these developments point to a broader shift in how Solana is being used: not just for speculative trading activity, but as a settlement layer for products that resemble traditional market infrastructure. That helps explain why the article frames the network as moving toward core internet capital markets infrastructure rather than remaining confined to its earlier memecoin cycle.
Grok frames the cumulative result as SOL transitioning from a throughput leader to core internet capital markets infrastructure. The bear-case risk is described as limited; however, upgrade delays, fading ETF inflows, or a broader macro risk-off environment could push SOL below current levels toward a range of $40 to $65.
Price Action and Technical Indicators
SOL's chart has not yet reflected the bullish fundamental outlook. The token peaked near $252 in September of the prior year and declined steadily through the following months.
In November, the price structure broke down, falling from $190 toward $122. February saw a capitulation leg that brought SOL down near $67. The spring period settled into a trading range between $80 and $98. June broke that range, marking a low around $61.
July marked the beginning of a recovery. Buyers established higher lows and lifted the price into the mid-$70s, where it currently trades. The most recent close was $76.19, down $0.02 or 0.03% on the day, with the session ranging from $75.48 to $77.09.
Support levels sit at $73, followed by $67 and the June floor of $61. Resistance is stacked at $80, $90, and $100. The Relative Strength Index (RSI) reads 55.00 against a signal line at 46.62 — a gap of more than 8 points that reflects notable buying pressure. Both lines now sit above the midline, indicating momentum has turned bullish following an extended flat period.
Grok's bear-case floor of $65 sits below the current price, which is notable. Reclaiming the $80 level would be the first technical confirmation of the broader bullish thesis.
Source: ICO Bench

