SHIB Price Faces Another Key Resistance Test at the 100-Day SMA
Key Takeaways
- •SHIB rose roughly 30% into July 26 but gave back a substantial portion of the gains and has since traded between the 50-day SMA near $0.00000447 and the 100-day SMA around $0.00000509.
- •The token briefly moved above the 100-day SMA on August 1 but closed back below it, and the August 2 intraday high of approximately $0.00000505 fell short of the average, marking two failed breakout attempts.
- •Active receiving addresses spiked to roughly 76,500 on July 6 before quickly returning to the low thousands, and the metric could not distinguish between new holders, exchanges, or existing investors relocating funds.
- •On the weekly timeframe, the more significant resistance sits at the 0.236 Fibonacci retracement level near $0.00000550, with additional barriers at the 200-day SMA around $0.00000570 and a horizontal level near $0.00000580.
- •Daily RSI stood near 62, indicating strengthening momentum that had not yet reached overbought territory.
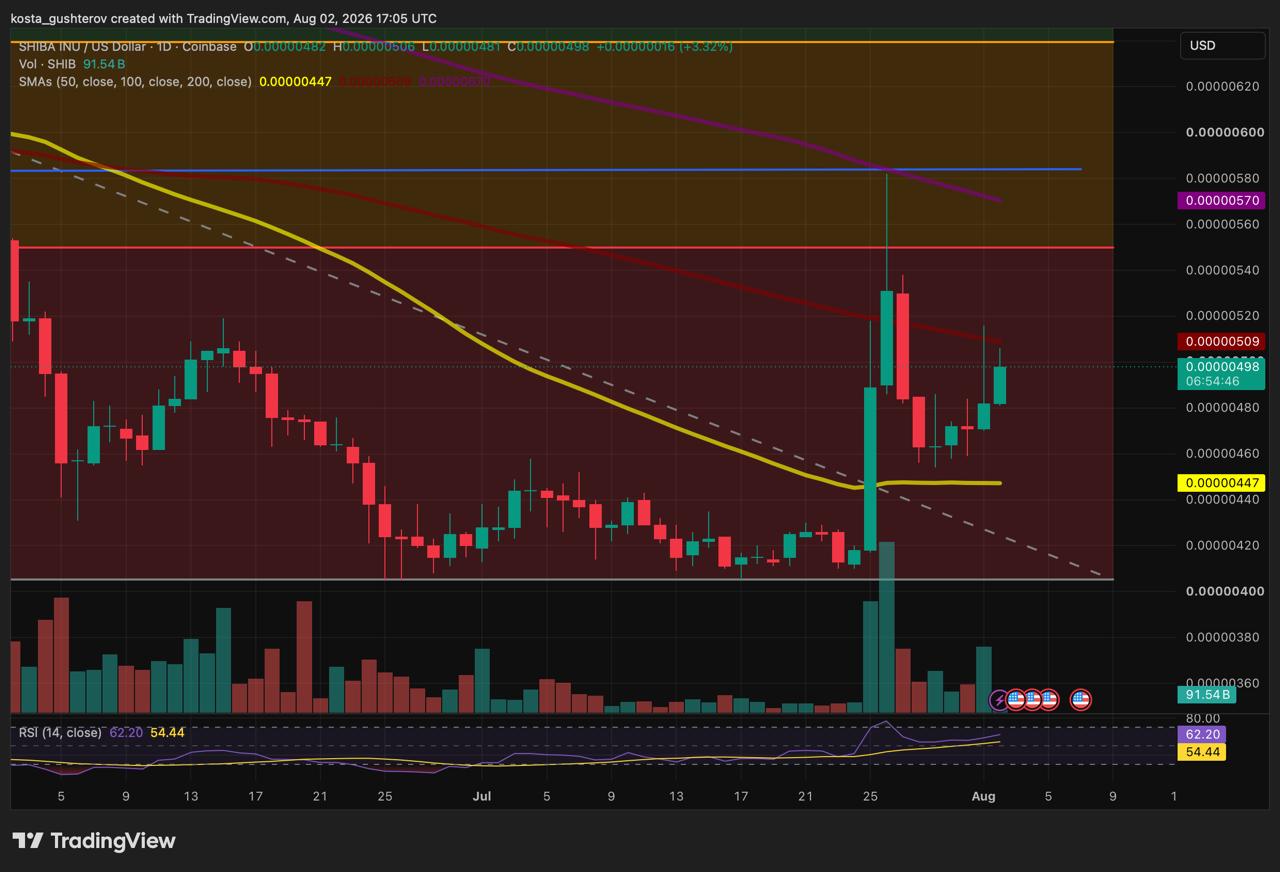
Shiba Inu (SHIB), the Ethereum-based meme token that launched in August 2020 and grew into one of the most widely held community-driven cryptocurrencies by market capitalization, rose roughly 30% into July 26 before giving back a substantial portion of that move. At the time of writing, SHIB traded near $0.00000496 — less than 3% below its 100-day simple moving average (SMA). Since July 27, the token has traded in a range between the 50-day SMA near $0.00000447 and the 100-day SMA around $0.00000509. Buyers have maintained price above the lower average but have not secured a daily close above overhead resistance.
Two Failed Attempts at the 100-Day SMA
The 100-day SMA is a widely followed medium-term trend indicator, and a sustained break above it often draws attention from chart-based traders watching for confirmation of a directional shift. SHIB briefly moved above the 100-day SMA on August 1 but closed back below it by the end of the session. On August 2, the intraday high reached approximately $0.00000505, falling just short of the average before price pulled back.
While recent closing levels have improved and lows have remained relatively stable, the August 2 peak stayed below the prior session's high. SHIB has therefore not yet established a clear sequence of higher highs on the daily chart.
A daily close above $0.00000509 would represent a more decisive break than another transient move through the average. Price would then need to hold above that level rather than retreating immediately back into the range.
Momentum has strengthened without becoming stretched. Daily RSI stood near 62 — above its own moving average but still below overbought territory. Volume has picked up from the quieter stretches of July but remains below the surge recorded during the July 25–26 advance.
If SHIB continues to close below the 100-day SMA, the nearest support sits at recent lows around $0.00000460, followed by the 50-day average near $0.00000447.
July Address Spike Fades Without Becoming a Trend
CryptoQuant's Active Receiving Addresses metric, which counts unique SHIB addresses receiving a transfer during each observation period, rose to approximately 76,500 on July 6 before quickly returning to the low thousands, where it stayed for most of the month.
The spike indicates that a large number of addresses received SHIB, but the metric cannot distinguish whether they were new holders, exchanges, or existing investors moving tokens between wallets. Exchange activity, wallet restructuring, or another one-time network event could have contributed.
Timing also limits any connection to price. Receiving activity normalized shortly after July 6, while SHIB's strongest advance arrived nearly three weeks later. Activity edged slightly higher again near the end of the measured period, though the increase remained small relative to the July 6 outlier.
Transaction value, exchange flows, new-address growth, and trading volume would provide additional context on the nature of these transfers. A sustained rise over several weeks would offer stronger evidence that SHIB was reaching a broader user base than a single isolated reading suggests.
The Larger Weekly Barrier Near $0.00000550
A close above the 100-day SMA would improve the daily chart structure, but on the weekly timeframe, the more significant resistance sits at the 0.236 Fibonacci retracement level near $0.00000550. Fibonacci retracement levels are derived from the mathematical ratios applied to a prior price swing and are commonly used by traders to identify potential reversal zones. Holding above that level on a weekly basis would move SHIB beyond the bounds of its current short-term rebound.
Additional resistance lies just overhead. The 200-day SMA stands near $0.00000570, followed by a horizontal barrier around $0.00000580. However, SHIB must first clear the 100-day average before those higher levels become relevant. Until then, price remains confined between short-term support and the moving average that has rejected both recent recovery attempts.
Disclaimer: This article is for informational purposes only and does not constitute financial or investment advice. Moving averages, Fibonacci levels, address activity, and trading volume do not guarantee future price performance.
Methodology: The analysis uses the SHIB/USD daily Coinbase chart dated August 2, 2026, including the 50-day, 100-day, and 200-day simple moving averages, RSI, volume, and Fibonacci levels. Network activity is assessed through CryptoQuant's Active Receiving Addresses chart covering July 2 through August 1.

