Seven Graphs for the Financial System: Debt, Equities, the Fed, Stablecoins and the Dollar
Key Takeaways
- •U.S. federal debt held by the public has climbed rapidly relative to GDP even during full employment, departing from the historical pattern of stabilizing in expansions.
- •The S&P 500 shows elevated cyclically adjusted price-to-earnings ratios and heavy concentration in the Magnificent 7 stocks, tying index performance to a handful of technology firms.
- •The actual federal funds rate currently sits above levels implied by Taylor rule benchmarks, according to Atlanta Fed data.
- •The Bordo-Siklos credibility measure indicates lower Federal Reserve credibility under the Trump 2.0 administration.
- •The GENIUS Act, signed into U.S. law in 2025, established a regulatory framework for payment stablecoins, while the dollar's reserve-currency dominance has eroded.
Prompted by current events in the financial system (and fall teaching), Econbrowser's Menzie Chinn presents a set of charts intended to provoke thought on the state of the U.S. and global economy.
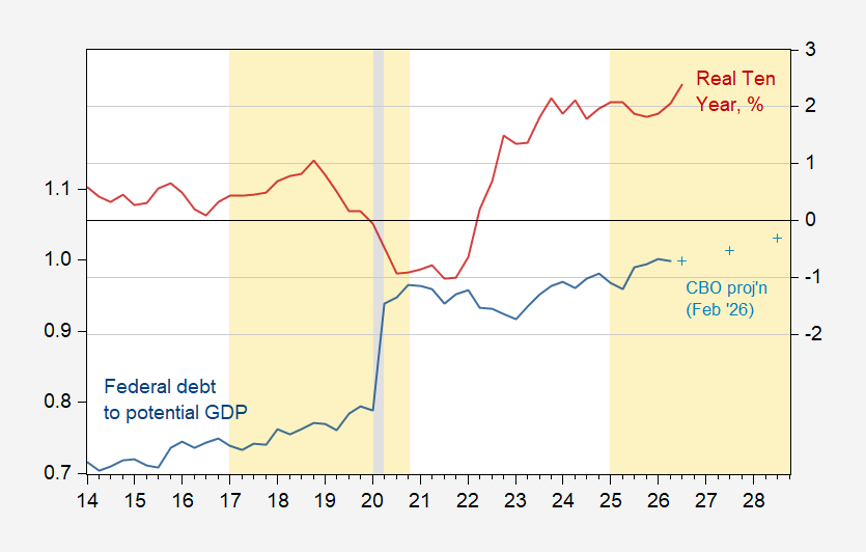
Federal debt rising even at full employment. Figure 1 shows the federal debt held by the public as a share of GDP (blue, left scale) alongside the Congressional Budget Office's February projection (+, left scale) and real ten-year interest rates measured by TIPS, in percent (red, right scale). The chart illustrates that debt has been climbing rapidly even during a period of full employment — a notable departure from historical patterns in which debt-to-GDP ratios typically stabilize or fall during expansions, leaving less fiscal room for the next downturn.
Stock market near a peak? Figure 2 plots the CPI-deflated S&P 500 (blue, left log scale) together with the cyclically adjusted price-to-earnings ratio, CAPE, in percent (red, right scale). Source: Shiller. Figure 3 shows total S&P 500 capitalization (blue bars) and the share accounted for by the Magnificent 7 stocks (red, right scale). Source: MacroMicro. The concentration measure matters because a large index share held by a handful of technology stocks means index performance increasingly reflects those firms' prospects rather than the broader market.
Fed policy above Taylor rule levels. Figure 4 compares various Taylor rule implied target federal funds rates against the actual rate (in black). Source: Atlanta Fed. The actual policy rate sits above the levels implied by the rule, a reference benchmark economist John Taylor proposed in 1993 that links the policy rate to inflation and economic slack.
Fed credibility lower under Trump 2.0. Figure 5 shows the Bordo-Siklos central bank credibility measure for the Fed over a five-year horizon (blue). The measure is calculated as |i−i*| when −1 < i−i* < +1, and (i−i*)² otherwise; higher values indicate lower credibility. The concept of central bank credibility — the public's confidence that a central bank will keep inflation near target — is widely viewed among economists as a precondition for keeping inflation expectations anchored with less policy tightening.
Stablecoins after GENIUS. Figure 6 examines stablecoins, drawing on Liang and Nieman, "Stablecoins after GENIUS" (2026). The reference is to the GENIUS Act, the U.S. federal stablecoin legislation signed into law in 2025, which established a regulatory framework for payment stablecoins.
Finally, though not on the syllabus: the dollar's dominance as the reserve currency has eroded (see Eichengreen's piece in the New York Times: Eichengreen in NYT). Reserve-currency status has historically given the United States the ability to borrow cheaply, and shifts in that position are closely watched as an indicator of longer-term changes in global finance.
Source: Econbrowser
