U.S. Renewable Energy Output Rises 10% in Early 2026, With Solar Continuing to Outpace Fossil Fuels and Nuclear
Key Takeaways
- •Renewable energy now accounts for approximately 30% of total U.S. electricity generation after increasing output by more than 10% in the first five months of 2026.
- •Combined wind and solar output exceeds coal-fired generation by 57%, while coal generation declined 10.9% and nuclear plus natural gas output fell 3.8% year-over-year.
- •Total U.S. renewable energy capacity grew 41% year-over-year, led by nearly 28 GW of utility-scale solar, 6.6 GW of distributed solar, and 16.5 GW of energy storage additions.
- •The SUN DAY Campaign projects 83 GW of new renewable capacity by May 2027, compared to a 4.7 GW decline in nuclear and fossil fuel capacity over the same period.
- •Federal investment tax credits established under the Inflation Reduction Act of 2022 have been a significant policy driver behind the ongoing renewable energy deployment pipeline.
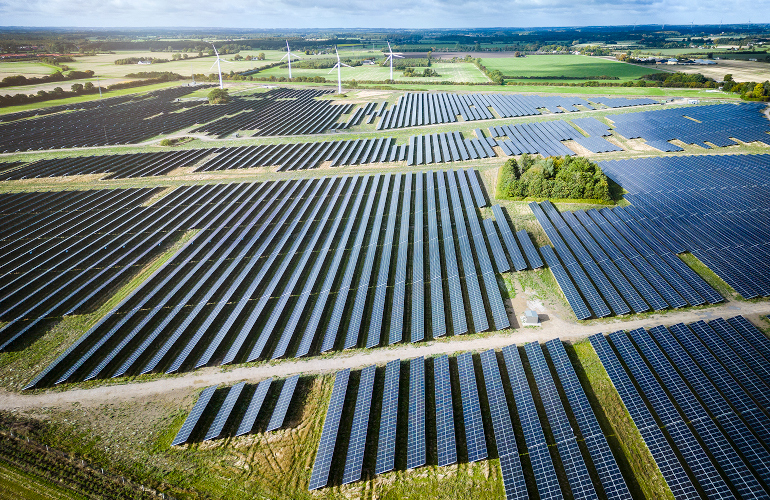
Renewable energy sources increased their electrical output by more than 10% during the first five months of 2026 and now account for approximately 30% of total U.S. electricity generation, according to an analysis of U.S. Energy Information Administration (EIA) data conducted by the SUN DAY Campaign, a nonprofit research and educational organization that advocates for sustainable energy. Natural gas remains the single largest source of U.S. electricity, which places the growth trajectory of solar and other renewables in the context of an ongoing transition in the nation's power mix.
Based on current deployment trends, the SUN DAY Campaign projects that renewable energy sources will add 83 GW of new capacity to the U.S. grid by the end of May 2027. Over the same period, nuclear and fossil fuel capacity is expected to decline by 4.7 GW. Federal incentives enacted under the Inflation Reduction Act of 2022, including investment tax credits for solar and storage projects, have been a significant policy driver behind this deployment pipeline.
According to the EIA's "Electric Power Monthly" report, utility-scale solar generation rose by approximately 21% compared to the same period a year earlier. Nuclear power and natural gas production collectively fell by 3.8%, while coal generation declined by 10.9%. Combined wind and solar output now exceeds coal-fired generation by 57%.
Over the 12-month period from May 2025 to May 2026, utility-scale solar capacity grew by nearly 28 GW, and small-scale (distributed) solar contributed an additional 6.6 GW. Utility-scale energy storage capacity expanded by 16.5 GW during the same timeframe, addressing the intermittency challenge that has historically limited solar and wind reliability on the grid. In total, renewable energy capacity increased by 41% year-over-year compared to the preceding 12-month period.
If current growth rates continue, the SUN DAY Campaign projects that solar capacity could overtake natural gas capacity by spring 2027.
Ken Bossong, executive director of the SUN DAY Campaign, commented on the findings: "Notwithstanding all the roadblocks erected by the Trump administration, the growth of solar, wind and battery storage is actually accelerating, proving once again that one cannot stop an idea whose time has come."
The EIA, a statistical agency within the U.S. Department of Energy, regularly publishes electricity generation and capacity data through its Electric Power Monthly series, which tracks output across all major energy categories including fossil fuels, nuclear, hydropower, wind, solar, and other renewables.

