Q2 Inflation Across the US Economy Surged to Multi-Year Highs, BEA Data Shows
Key Takeaways
- •The GDP deflator surged 6.3% annualized in Q2, marking the largest quarterly increase since Q2 2022, while year-over-year GDP inflation reached 4.3%.
- •Core GDP inflation, which excludes energy and food, rose 4.4% annualized in Q2, demonstrating that intense price pressures persist even without volatile energy costs.
- •The quarterly PCE price index, the Federal Reserve's preferred inflation benchmark, increased 5.1% annualized in Q2, the second-worst quarterly reading since Q1 2022.
- •Year-over-year inflation rates across all major measures have been accelerating for four consecutive quarters, a trend that began before recent geopolitical developments including the war in Iran.
- •The broader US economy is experiencing higher inflation than consumers alone, as businesses and governments face even steeper price increases in areas such as commercial construction and government contracting.
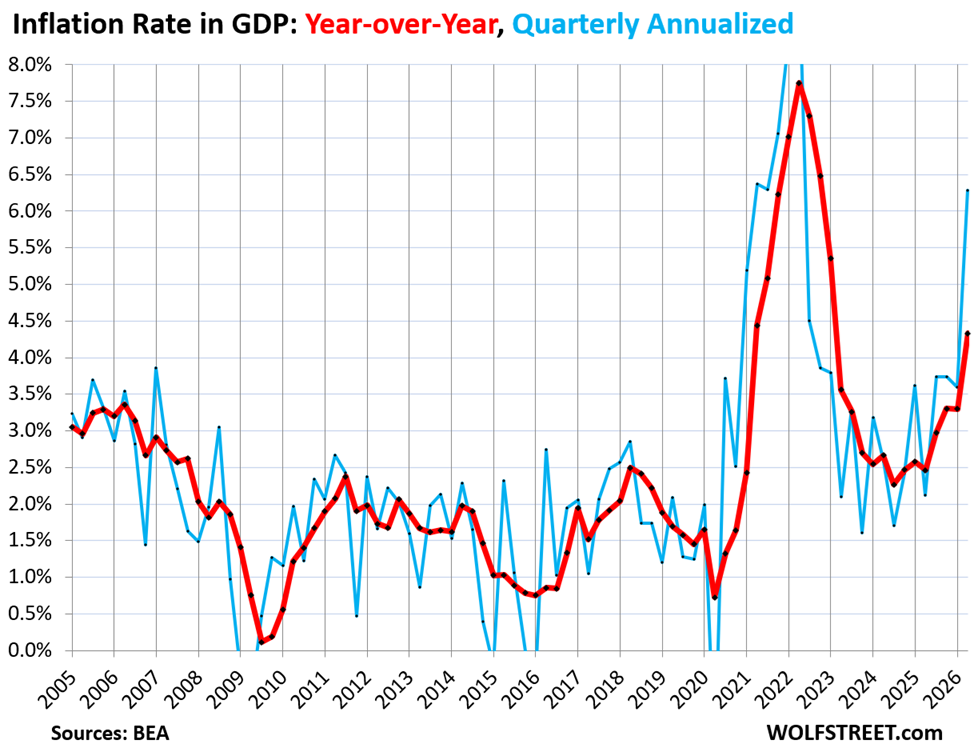
Broad GDP Inflation Measures Show Sharp Acceleration in Q2
The Bureau of Economic Analysis (BEA) released its quarterly inflation data across the GDP accounts as part of a broader data release. These figures track price changes across all goods and services purchased by every participant in the US economy — consumers, businesses, and governments — making them considerably broader in scope than consumer-focused measures such as CPI or the PCE price index. Because all GDP data are reported on a quarterly basis, they tend to smooth out the volatility often seen in monthly reports. These broader measures receive less public attention than the monthly CPI or PCE reports, yet they offer a more complete picture of price pressures across the full economy, including business investment and government procurement.
By every major measure, Q2 inflation was severe — even after stripping out energy costs.
GDP Deflator: Overall Economy-Wide Inflation
The GDP deflator, which captures inflation across the entire economy, surged by 6.3% in Q2 on an annualized quarter-over-quarter basis — the largest increase since Q2 2022. On a year-over-year basis, GDP inflation jumped by 4.3%, the worst reading since Q1 2023.
Energy prices did spike during Q2, though they began declining in the second half of the quarter. However, the core GDP inflation measure, which excludes both energy and food, also rose sharply — by 4.4% annualized in Q2 from Q1, the worst reading since Q1 2023. Year-over-year, core GDP inflation reached 3.8%, the highest since Q2 2023.
Both the overall and core GDP inflation measures indicate intense price pressures across the entire US economy, running at roughly double to triple the Federal Reserve's 2% inflation target. On a year-over-year basis, these inflation rates have been accelerating for four consecutive quarters — a trend that predates the recent geopolitical developments including the war in Iran.
PCE Price Index: Consumer-Focused Inflation
The Federal Reserve does not use the GDP deflator as its benchmark for its 2% inflation target. Instead, it relies on the PCE price index, which measures consumer price inflation specifically. The quarterly PCE price index, also released by the BEA, showed a similar trajectory.
The consumer-oriented quarterly PCE price index rose by 5.1% annualized in Q2 from Q1 — the second-worst quarterly increase since Q1 2022. This metric is a subset of the broader GDP inflation data, focusing specifically on prices paid by consumers for goods and services.
Year-over-year, the quarterly PCE price index climbed by 3.8%, the worst reading since Q2 2023.
Core PCE Price Index: Inflation Excluding Energy and Food
Energy was one contributing factor to Q2 inflation, even though energy prices were already falling during the latter part of the quarter. However, energy was not the sole driver. The year-over-year acceleration away from the Fed's 2% target began a year ago.
The quarterly core PCE price index, which excludes energy and food, rose by 3.4% annualized in Q2 — the second-worst quarter-over-quarter increase since Q1 2024, with only the prior quarter posting a worse figure.
Year-over-year, the quarterly core PCE price index jumped by 3.3%, the largest increase since Q2 2023.
Broader Economy Faces Higher Inflation Than Consumers Alone
Quarterly consumer price inflation remains elevated, even excluding energy. However, businesses and governments are facing even higher inflation rates, which means the overall inflation rates for the US economy currently exceed consumer-specific inflation rates. This divergence suggests that price pressures extend beyond household purchases into areas such as commercial construction, equipment investment, and government contracting — components that consumer-focused metrics do not capture.
The sustained acceleration across these measures has intensified scrutiny of the Federal Open Market Committee's (FOMC) response, as every major inflation gauge now sits well above the central bank's 2% target. Meanwhile, the bond market has already been reacting, with the 30-year Treasury yield reaching its highest level since 2007.

