Pump.fun rebound faces a defining test at the $0.003746 hourly pivot
Key Takeaways
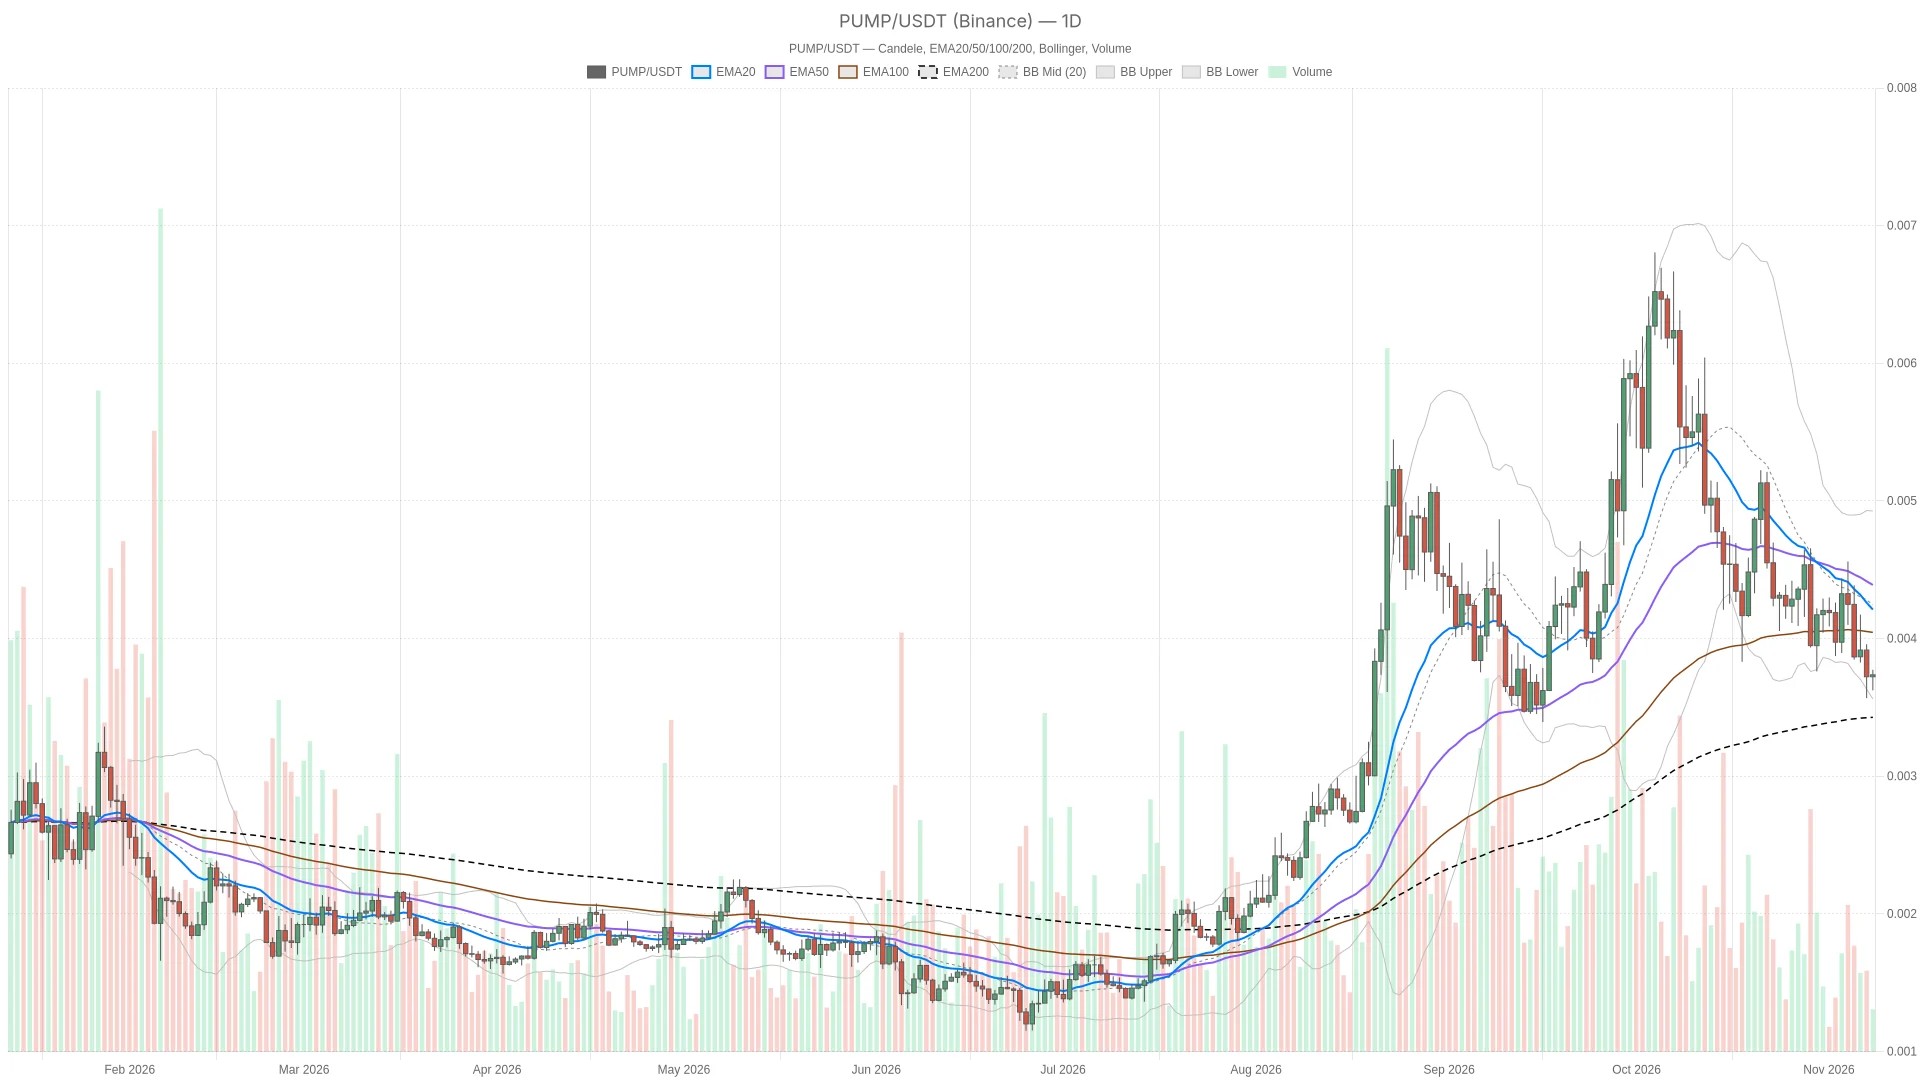
- •$PUMP traded at $0.003737 on Binance as of November 8, 2026, holding above the daily EMA200 at $0.003425 but remaining beneath the daily EMA20 at $0.004261 and daily EMA50 at $0.004416, leaving the daily regime neutral with a defensive bias.
- •The key directional test is tightly framed: an hourly close above the hourly pivot at $0.003746 would activate the bullish rebound scenario, while an hourly close below the hourly Bollinger upper band at $0.003733 would trigger the bearish case, with only about a quarter of an hourly ATR separating the two levels.
- •Momentum indicators diverge across timeframes, as daily RSI is falling at 38.5 and the daily MACD histogram is negative and widening, whereas hourly RSI at 53.0 and a positive, widening hourly MACD histogram support the short-term rebound.
- •The price sits in the lower portion of the daily Bollinger envelope between the lower band at $0.003633 and the midpoint at $0.004282, making the bounce read more as a potential mean-reversion move than evidence of a renewed uptrend.
- •Market-wide context shows fearful sentiment, with the Fear & Greed Index at 28, total cryptocurrency market capitalization near $2.53 trillion, and Bitcoin dominance at 60.01%, reinforcing caution without resolving the conflict between daily weakness and intraday strength.
Pump.fun rebound faces a defining test at the $0.003746 hourly pivot
As of November 8, 2026, $PUMP changes hands at $0.003737 on Binance, and the Pump.fun price setup remains neutral on the daily chart with a bearish tilt. Short-term momentum is improving, but the rebound has not yet repaired the broader daily structure, leaving a dense band of overhead levels to decide the token's next directional test.
Daily caution conflicts with intraday strength
The dominant tension in the current setup is between a tactical recovery and a reversal that has yet to be confirmed. Price holding above the daily EMA200 prevents the chart from being uniformly bearish, but nearby pivot resistance still separates a simple bounce from a more credible recovery.
The daily chart describes a neutral regime rather than a clean directional trend. $PUMP sits below its daily EMA20 and EMA50 but above its daily EMA200, and the three averages are not aligned. That produces a defensive bias without confirming a fully bearish long-term structure.
The hourly chart, by contrast, delivers a stronger rebound signal, though not yet a trend reversal. Price is above the hourly EMA20 but below the hourly EMA50 and hourly EMA200, whose structure remains bearishly stacked. Improving hourly momentum therefore weakens the immediate downside case without overturning the daily caution.
The 15-minute chart adds useful execution context: price is above the EMA20 and EMA50 but below the EMA200, with the averages misaligned. The shortest horizon supports the bounce but cannot establish that the larger trend has turned.
Pivot resistance sits inside a broad daily volatility range
The daily EMA20 at $0.004261 and the daily EMA50 at $0.004416 remain overhead resistance, while the daily EMA200 at $0.003425 offers support below the market. The distance to the shorter daily averages illustrates how much structural repair a sustained recovery would still require: measured in daily ATR, the EMA20 sits just over one average daily move above the current price, while the EMA200 lies roughly two-thirds of an average daily move below it.
Bollinger Bands—volatility envelopes plotted around a moving average—reinforce that imbalance. Price is trading between the daily Bollinger lower band at $0.003633 and the daily Bollinger midpoint at $0.004282, placing it in the lower part of the daily envelope. A rebound from here is therefore better read as a potential mean-reversion move back toward the middle of the envelope than as evidence of a renewed uptrend.
At the shorter horizon, the hourly price of $0.003736 sits just above the hourly Bollinger upper band at $0.003733. That marks local strength, but it also places the bounce at an extension point while the daily chart remains weak—the two signals conflict rather than confirm each other.
Volatility measurements put the nearby pivot tests in perspective. Daily ATR—a gauge of the typical size of recent price candles—stands at $0.0004637, compared with hourly ATR of $0.00005126 and 15-minute ATR of $0.00002507. Within these ranges, a small move through resistance is not, by itself, a meaningful change in daily structure.
RSI improves intraday while daily MACD deteriorates
Momentum readings diverge across timeframes. Daily RSI is falling at 38.5, hourly RSI is rising at 53.0, and the 15-minute reading of 65.0 has a recent direction classified as flat. Momentum is therefore healthier intraday than on the daily chart, though none of these readings is beyond the conventional overbought (70) and oversold (30) thresholds.
MACD sharpens the disagreement. The daily histogram is negative and widening, signaling worsening downside momentum, while the hourly histogram is positive and widening, supporting the rebound. The 15-minute histogram is positive but flat, confirming positive momentum on the shortest chart without fresh acceleration. For $PUMP's outlook, the missing ingredient is daily confirmation—not another positive short-term reading—and a first, watchable sign of it would be the daily histogram simply ceasing to widen.
Pivot reclaim or upper-band failure defines the next test
The nearest resistance is the hourly pivot at $0.003746, followed by the daily pivot at $0.003750. Beyond those sit hourly R1 at $0.003767 and the hourly EMA50 at $0.003787. The nearest support is the hourly Bollinger upper band at $0.003733, followed by hourly S1 at $0.003717. With levels this tightly spaced, closing confirmation carries more weight than an intrabar touch: the distance between the nearest support and resistance is only about a quarter of a single hourly ATR ($0.00005126), so one typical hourly candle spans more than the entire decision zone.
Bullish scenario: an hourly close above $0.003746
An hourly close above the hourly pivot at $0.003746 would activate the bullish rebound scenario. The last completed hourly candle closed at $0.003739, so the trigger remains unmet. The daily pivot would be the immediate obstacle, with hourly R1 and the hourly EMA50 waiting beyond it. An hourly close back below the hourly Bollinger upper band at $0.003733 would invalidate the local bullish setup.
The likeliest false bullish signal is a brief pivot breakout that fails before clearing the next resistance. Even a successful hourly move would not erase daily momentum weakness; daily R1 at $0.003932 remains a separate, higher hurdle.
Bearish scenario: an hourly close below $0.003733
An hourly close below the hourly Bollinger upper band at $0.003733 would activate the bearish scenario, exposing hourly S1 at $0.003717 and then the hourly EMA20 at $0.003701. An hourly close above the hourly pivot at $0.003746 would invalidate that local breakdown.
The likely false bearish signal is a shallow loss of the upper band that holds above hourly S1 and reverses. A broader deterioration would bring the daily Bollinger lower band at $0.003633 into focus, followed by daily S1 at $0.003541. Daily volatility leaves room for both upside and downside probes without settling the larger trend.
Fearful sentiment adds caution, not a directional trigger
Alternative.me's Fear & Greed Index stands at 28 on its 0–100 scale, classified as Fear. CoinGecko reports total cryptocurrency market capitalization of $2,534,132,186,364.47 with Bitcoin dominance at 60.01%. These are market-wide context rather than $PUMP-specific signals: sentiment supports caution but does not resolve the disagreement between daily weakness and intraday strength.
FAQ
Is $PUMP in a confirmed bullish trend?
No. The daily regime is neutral, and price remains beneath the daily EMA20 and EMA50. The hourly recovery has not yet repaired that structure.
Does the 15-minute RSI show overbought conditions?
No. Its reading of 65.0 is below the overbought threshold, although it is stronger than both the hourly and daily readings.
Disclaimer: This article is for informational purposes only and does not constitute financial advice, an investment recommendation, or a solicitation to buy or sell any financial instrument or cryptocurrency. The analysis provided is not indicative of future results. Investing in crypto assets and financial markets carries a high risk of capital loss. Always do your own research (DYOR) and consult a qualified financial advisor before making any decision. Article produced with the assistance of artificial intelligence and reviewed by the editorial team.

