SONAR's Pricing Power Index Tracks a Five-Week Slide in Carrier Leverage
Key Takeaways
- •The Pricing Power Index is a composite of eight SONAR freight metrics scored from 0 to 100, where readings above 50 indicate carrier leverage and readings below 50 favor shippers.
- •The index has fallen for five straight weeks since its mid-July peak as freight capacity has eased and previously strong demand signals such as rail volume and ocean import bookings have cooled.
- •The spot-to-contract rate spread, which reached a record high about one month ago, has narrowed significantly, suggesting shippers may be gaining negotiating leverage on contract terms.
- •The three-month forward forecast has retreated and now converges closer to the current index reading, whereas it had been diverging just weeks earlier.
- •The downward trend arrives during what is typically a peak freight season, prompting questions about whether softer import volumes and ample capacity are overriding the usual seasonal tightening.
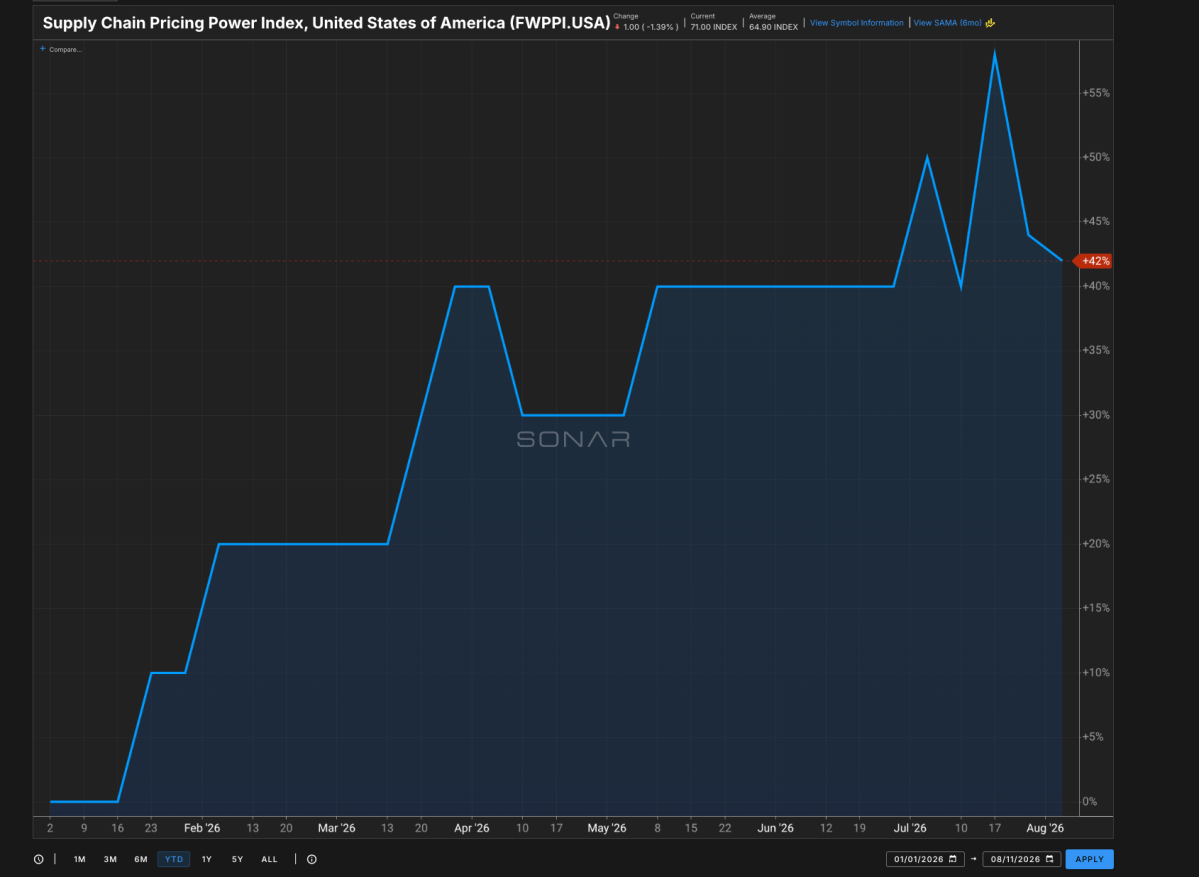
Each week, SONAR's Research team distills the freight market into a single figure: the Pricing Power Index (PPI). The index provides a rapid assessment of a question central to procurement strategy, bid timing, and carrier negotiations — whether pricing power currently rests with carriers or with shippers.
The PPI is not a subjective gauge or a retrofitted narrative. It is a direct-weighted, data-driven composite of eight SONAR metrics: tender rejections, accepted volume, rail volume, ocean TEU bookings, spot rates, van contract rates, the spot-to-contract spread, and intermodal contract rates. Each metric is ranked against five years of its own weekly history and combined into a single score ranging from 0 to 100. A reading of 50 indicates a historically balanced market. Readings above 50 signal that leverage has tilted toward carriers, while readings below 50 indicate leverage favoring shippers. A companion three-month outlook applies the same methodology to a 90-day-forward projection, giving readers a view of both current market positioning and where SONAR's model expects conditions to be heading into the next quarter.
What This Week's Release Shows
The PPI has been declining for five consecutive weeks since reaching a peak in mid-July. The pullback comes as freight capacity has eased and several demand signals that had been running hot — specifically rail volume and ocean import bookings — have cooled. The spot-to-contract spread, which reached a record high approximately one month ago, has narrowed sharply in recent weeks. That spread is one of the most closely watched indicators in freight procurement: when spot rates run well above contract rates, it signals tight capacity and carrier leverage; as it compresses, shippers typically gain negotiating room on contract terms. The three-month forecast has also retreated, now converging much closer to the current reading than it was diverging just a few weeks prior.
The five-week slide arrives at a point in the calendar when freight markets typically brace for peak season — the late-summer-through-fall window when retail restocking ahead of holiday demand historically tightens truckload capacity and pushes rates higher. A declining PPI during this period raises the question of whether the expected seasonal tightening is materializing on schedule or whether softer import volumes and ample capacity are overriding the usual pattern. Whether this movement signals a genuine shift in carrier leverage ahead of peak season or represents a seasonal pause before conditions tighten again is the type of question the PPI is designed to address. The full analysis is detailed in this week's release.
Where to Access the Index
The Weekly Pricing Power Index is published every week and is available through two channels:
- FreightWaves Market Monitor (getfreightdata.com) — full access to the PPI release at $199 per month.
- SONAR platform Research library — enterprise SONAR customers can access every PPI release along with the full research archive via the clock icon in the platform's upper-right menu, under Research (sonar.surf/research-library).
Freight markets rarely move based on a single signal. The PPI's value lies in performing the synthesis — consistently, quantitatively, and against real historical context — so that readers do not need to manually reconcile eight separate indicators each week to determine who holds the leverage.
