Pi Network slides below $0.090 for fifth straight day as open interest climbs
Key Takeaways
- •PI fell below $0.090 for a fifth consecutive session on Monday, trading near $0.0865 despite an optimistic broader crypto market, where the Fear and Greed Index stood at 67.
- •Futures open interest climbed roughly 3.8% to $10.15 million from $9.78 million, indicating growing derivatives participation that does not by itself reveal whether positioning is bullish or bearish.
- •PI trades beneath all major daily exponential moving averages, with the 50-day EMA at $0.0911 as the first recovery barrier and additional resistance around $0.0990 to $0.0991.
- •Momentum indicators remain subdued, with the RSI near 43 and the MACD slightly negative, keeping sellers in the technical advantage.
- •Immediate downside support sits at $0.0827, with the July 31 low of $0.0801 and the $0.0704 swing low as the next levels to watch if selling pressure continues.
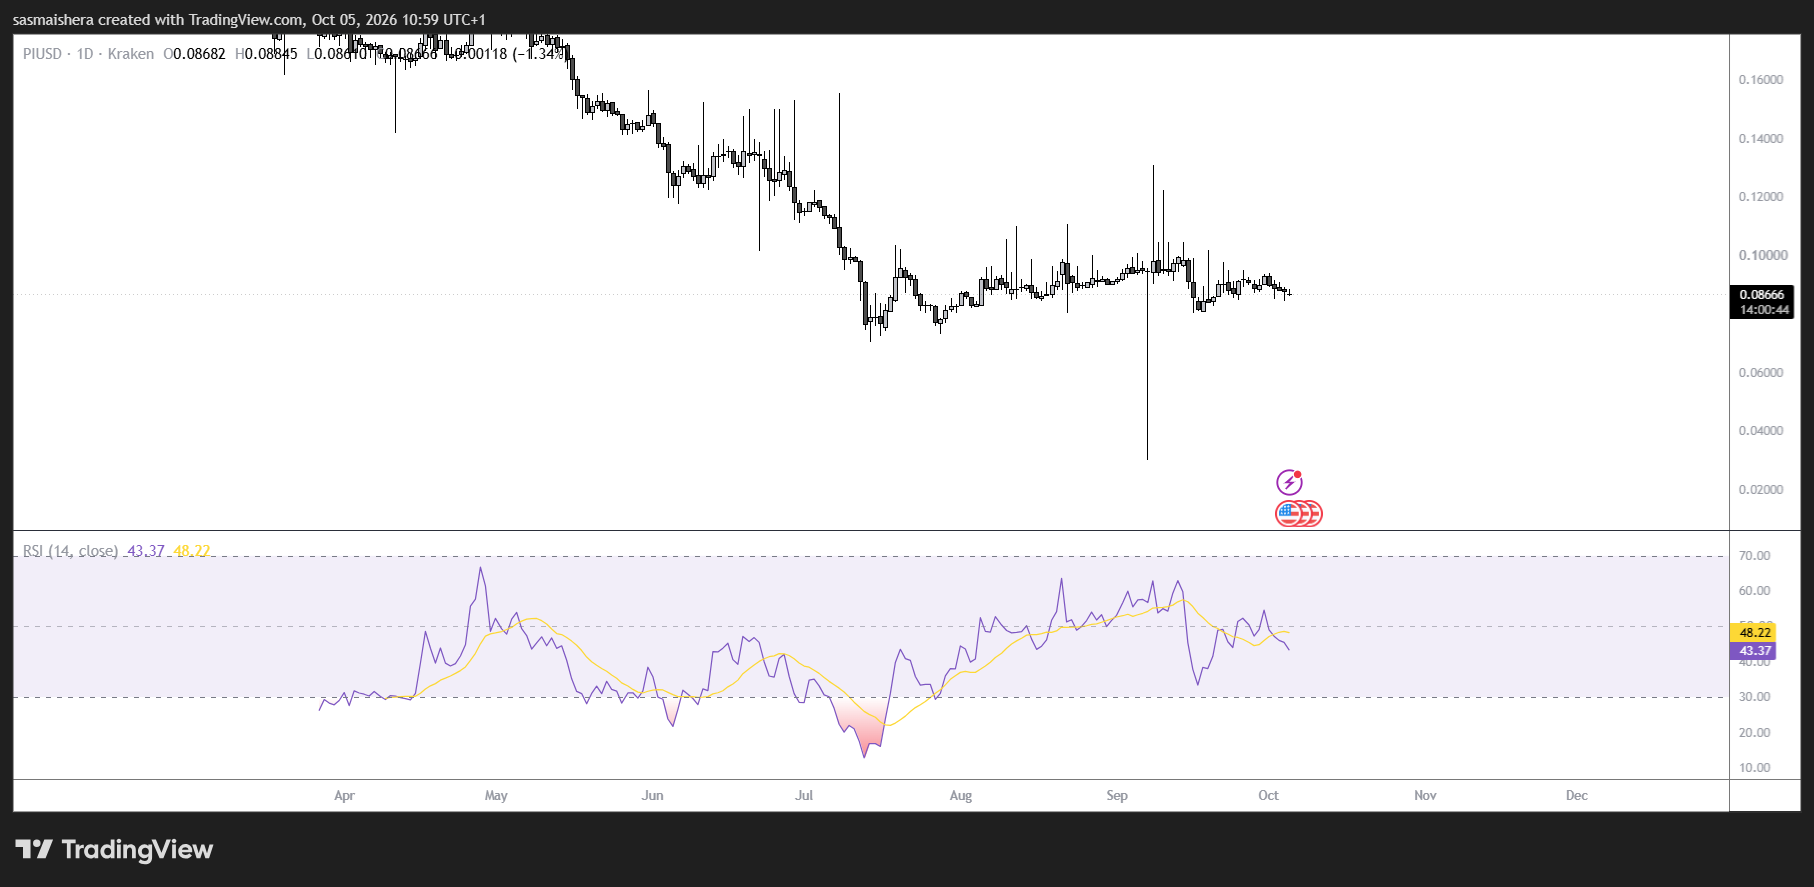
Pi Network's PI token extended its slide on Monday, falling below $0.090 for a fifth consecutive session and changing hands near $0.0865. The continued weakness stands out against a comparatively upbeat backdrop across the wider cryptocurrency market.
According to CoinMarketCap, the broader Fear and Greed Index stood at 67. The gauge condenses a range of market signals into a single reading on a 0–100 scale, and the current figure places overall sentiment firmly in greed territory. That level implies participants across the market retain an appetite for risk, yet the optimism has not carried over into a sustained recovery for PI.
The gap between the broad market mood and the token's own performance underscores the weight of PI's individual price structure, and it means the token's near-term course is more likely to be judged against its own chart levels than against the wider market's mood. With the price declining and momentum indicators subdued, buyers have so far struggled to take control. The token's next direction hinges on whether nearby support draws enough demand to halt the slide, or whether selling pressure pushes the price toward its recent lows.
Open interest rises as price falls
Data from CoinAnk shows PI futures open interest at $10.15 million, up from $9.78 million a day earlier. The increase of roughly 3.8% points to a modest buildup in outstanding derivatives exposure even as the spot price continues to slip.
Open interest measures the notional value of active contracts. A rise indicates continued participation, but on its own it says nothing about whether positioning leans bullish or bearish. The latest increase therefore should not be read as confirmation of stronger buying demand: new short positions, additional long exposure, or a combination of the two could all account for it. Whether that buildup extends or unwinds in coming sessions is one derivatives-side data point worth tracking alongside the price action described in the technical picture below.
For traders carrying leveraged long positions, the ongoing weakness in spot prices presents a tangible risk. Rising open interest alongside falling prices makes the direction and resilience of that exposure a relevant consideration, although the available figures do not establish which side dominates.
Technicals remain tilted toward sellers
PI continues to trade below its major daily exponential moving averages, a configuration that reinforces the bearish technical picture. The 50-day EMA sits at $0.0911, above the current price and serving as the first obstacle for any recovery attempt. The 100-day EMA is positioned near $0.0991, while the 200-day EMA stands considerably higher at $0.1219. The arrangement shows the token has reclaimed neither its shorter-term trend reference nor averages tied to its broader price direction.
Momentum readings lean the same way. The Relative Strength Index is approximately 43, below the neutral midpoint of 50, pointing to weaker buying momentum even though the indicator has not entered the conventional oversold zone below 30. The Moving Average Convergence Divergence, meanwhile, remains slightly negative. Taken together, the RSI and MACD readings support a cautious near-term outlook, with sellers retaining the technical advantage.
On the downside, immediate support sits at $0.0827, corresponding to the 23.6% Fibonacci retracement measured between $0.1341 and $0.0704. The July 31 low of $0.0801 provides another nearby reference. Should PI lose those levels, the $0.0704 swing low becomes the next downside area to monitor. A move toward that mark would represent a deeper extension of the current decline rather than confirmation that a rebound is underway.
Any recovery would first require buyers to overcome the 50 EMA at $0.0911. Beyond it, resistance clusters around the 50% Fibonacci retracement at $0.0990 and the 100-day EMA at $0.0991. Reclaiming those barriers would improve the technical picture. Until then, rising derivatives participation offers limited reassurance against the token's persistent price weakness.
This article originally appeared on CoinJournal.

