Peter Brandt's $8,600 Ether chart hinges on a first break above $5,000
Key Takeaways
- •Peter Brandt published a long-term Ether chart based on CME futures on September 21, showing a printed target of $8,674.50 that he rounds to $8,600.
- •The $8,600 target is conditional on Ether first clearing $5,000, a gate roughly 86% above the token's recent price near $2,693, while the full move would imply an approximately 219% gain.
- •The chart identifies $3,000 as the first short-term resistance, following Ether's climb from about $2,360 earlier in September, and Brandt gave no timetable for the scenario.
- •Brandt emphasized that presenting a chart is not a trade and that an X post is not proof, applying the same disclaimer to a same-day XRP chart mapping a path to $5.40.
- •US spot Ether ETFs recorded roughly $270 million in single-day inflows on September 21, their largest since October 7, 2025, a data point separate from and not a confirmation of the chart scenario.
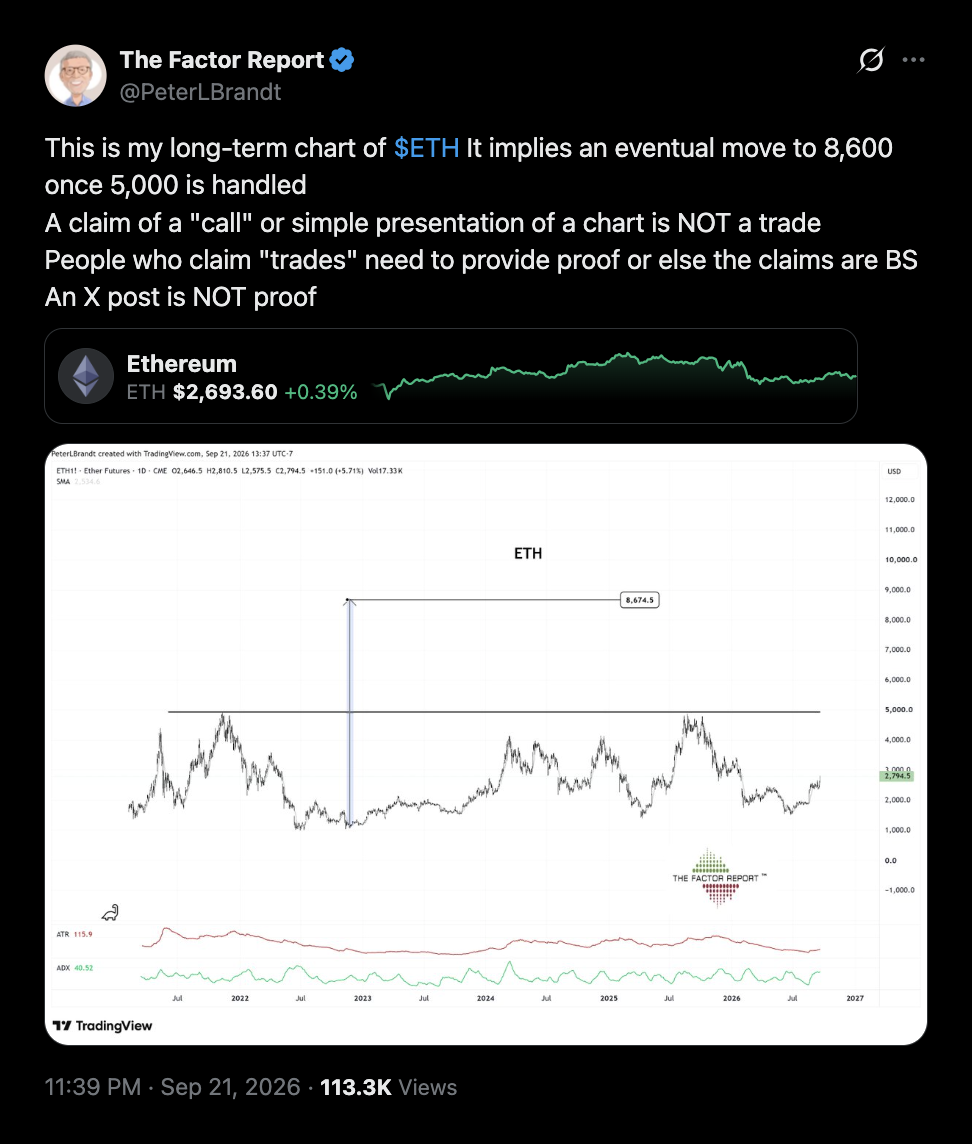
Peter Brandt's long-term Ether chart points to a target of $8,600, but only if ETH first clears $5,000. With the token trading near $2,693, that first hurdle alone sits roughly 86% above current levels. Until that gate is cleared, the $8,600 figure remains a mapped scenario on the chart rather than an active level.
CME futures chart marks the top line at $8,674.50
The chart, which is based on CME Ether futures, was posted on X by Brandt on September 21. The printed target reads $8,674.50, though Brandt rounds it down to $8,600.
“It implies an eventual move to 8,600 once 5,000 is handled,” Brandt wrote. He did not provide a date or timetable for the forecast.
Measured from the chart's levels, a climb from $2,693 to $5,000 represents a gain of about 86%, while the full route to $8,600 implies a rise of roughly 219%. The nearer-term picture begins at $3,000, the first short-term resistance, and Ether has climbed from approximately $2,360 earlier in September. Beyond that sits the $5,000 threshold Brandt treats as the gate, with the $8,600 target another 72% above a $5,000 print. Those two markers — $3,000 and then $5,000 — are the levels the chart itself defines before the $8,600 figure enters the picture, giving readers a fixed yardstick for tracking Ether against Brandt's scenario without any implied timetable.
The same no-trade caveat covered XRP's $5.40 path
“A claim of a ‘call’ or simple presentation of a chart is NOT a trade,” Brandt wrote, adding that anyone who claims a trade needs to provide proof. “An X post is NOT proof,” he said.
He issued the same disclaimer the same day on a separate long-term XRP chart mapping a path to $5.40, as Cryptopolitan reported. Repeating the wording across two charts in one day underlines where Brandt draws the line: publishing a chart is a presentation, and only documented positions count as trades — a distinction worth keeping in mind whenever a chart post circulates online as a signal.
Brandt has been trading commodities since 1976 and founded Factor Trading in 1980, giving him nearly five decades of market experience behind the charts he publishes.
In a related note, Cryptopolitan also reports that US spot Ether ETFs recorded their biggest single-day inflow since October 7, 2025 on September 21, with the haul coming to around $270 million. The tally landed on the same day Brandt shared his chart, making the flows a same-day snapshot of demand for Ether exposure through US-listed funds — a separate data point from, and not a confirmation of, the chart scenario above.

