NVIDIA Q2 FY27 Earnings Explained: What $96.2B Revenue and Guidance Mean for NVDA Stock
Key Takeaways
- •NVIDIA's Q2 FY27 revenue of $96.2 billion rose 18% quarter over quarter and 106% year over year, with Data Center contributing $89.0 billion, up 18% sequentially and 117% year over year.
- •Gross margin was 75.0% on both GAAP and non-GAAP bases, producing GAAP operating income of $63.734 billion, GAAP net income of $59.688 billion, and diluted EPS of $2.46 GAAP and $2.22 non-GAAP.
- •The company generated $21.341 billion in free cash flow, returned about $26.0 billion to shareholders during the quarter, and retained roughly $99.0 billion under its buyback authorization.
- •Management's Q3 FY27 outlook targets revenue of about $108.0 billion plus or minus 2% and gross margin of 74.0% plus or minus 50 basis points, while assuming no Data Center compute revenue from China.
- •Edge Computing revenue of $7.2 billion, up 13% sequentially and 27% year over year, provides a secondary growth vector, though roughly nine-tenths of quarterly revenue still comes from Data Center.
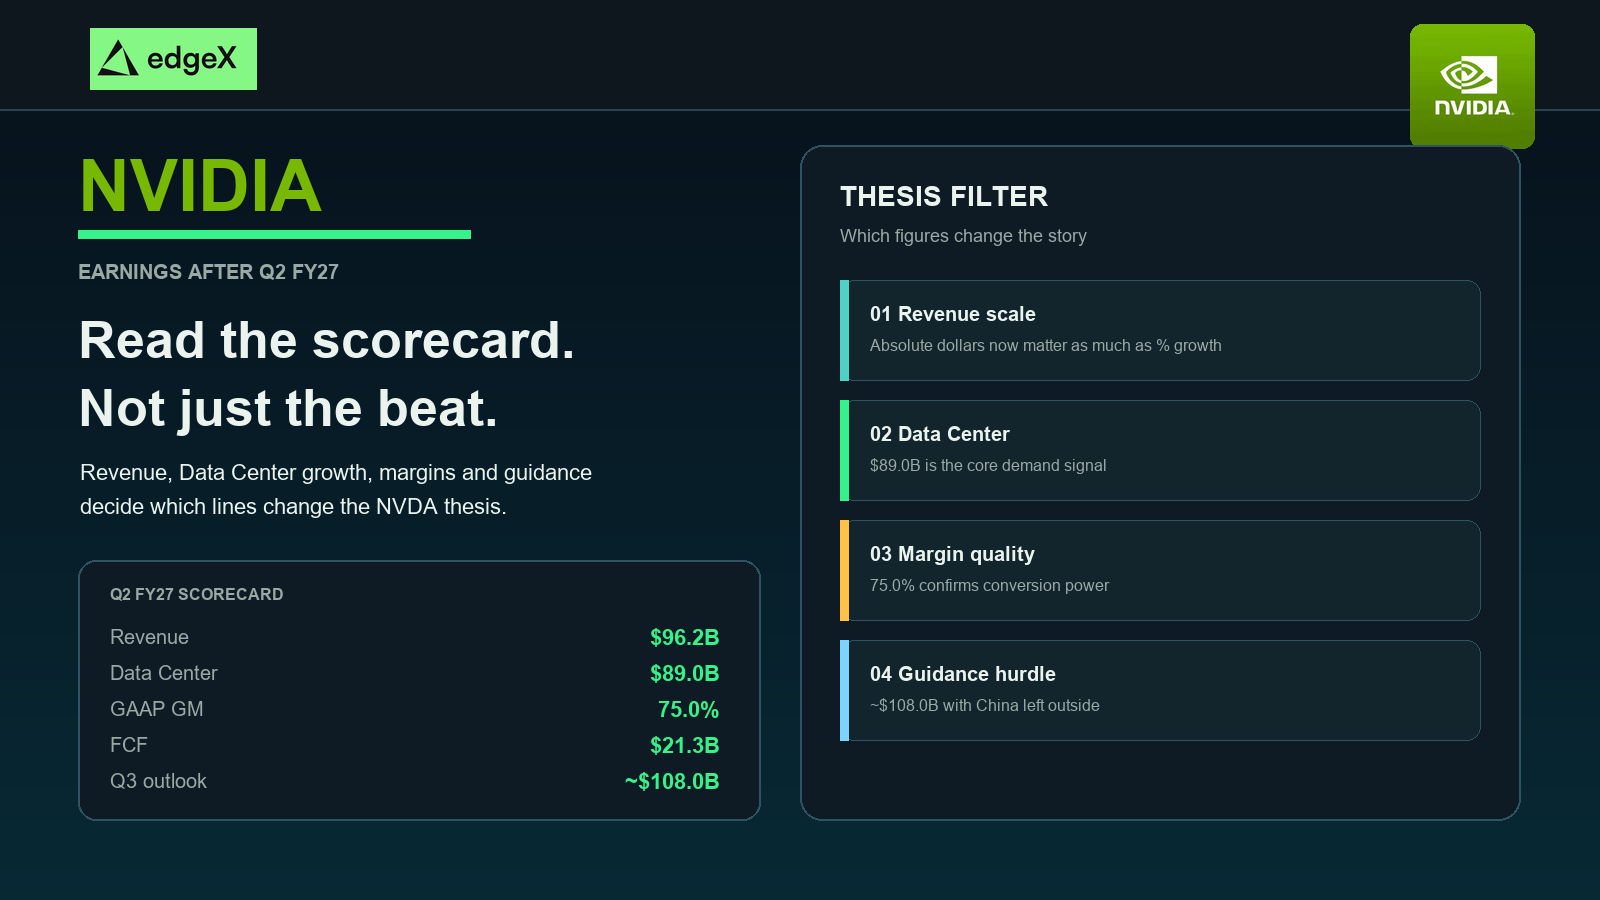
NVIDIA’s second-quarter fiscal 2027 report was not hard to summarize. Revenue reached $96.2 billion. Data Center contributed $89.0 billion. Gross margin held at 75.0%. Management then pointed to a third-quarter outlook of about $108.0 billion. The harder work is deciding which of those lines actually change an investor’s thesis and which ones merely confirm what the market already expected.
This article is a reading guide for NVIDIA earnings, not a broad company primer and not a valuation model. It focuses on the scorecard: revenue quality, Data Center growth, margin durability, cash generation, and guidance assumptions. For the wider business context, see the NVIDIA stock guide. For duration and multiple debates after the same print, see NVIDIA stock valuation after Q2 FY27.
Quick Answer
NVIDIA earnings after the $96.2 billion Q2 FY27 report should be read as a five-part scorecard: absolute revenue scale, Data Center growth, margin quality, cash returned to shareholders, and the credibility of the next-quarter guide. Investors should treat the $89.0 billion Data Center print as the core demand signal, the 75.0% gross margin as the quality check, and the roughly $108.0 billion Q3 outlook as the continuity test. The China assumption inside guidance is a risk disclosure as much as a forecast detail. Use the print to update the thesis, then decide separately whether the stock’s price already reflects that update.
Why NVIDIA Earnings Need a Thesis Filter
At NVIDIA’s current size, a strong quarter can still leave investors arguing about opposite conclusions. One reader sees proof that AI infrastructure demand is compounding. Another sees a harder comparison set, a higher expectation bar, and less room for error. Both can be looking at the same release. The difference is the filter each investor applies before deciding what the numbers mean for NVDA stock.
A useful filter starts with three questions. First, did demand broaden or merely ship into an already-visible backlog? Second, did profitability hold as the mix and architecture cycle evolved? Third, did management raise the near-term hurdle in a way that looks achievable without assuming a perfect geopolitical backdrop? Those questions matter more than whether diluted EPS printed above a consensus number that may already have been stale by the time the release landed.
That is why this guide separates the scorecard from the story. The story can be that AI has reached an inflection point and that compute is becoming revenue. The scorecard asks whether the financial evidence still supports that claim at a $96 billion quarterly run rate. If the evidence weakens while the story stays loud, the earnings reaction can turn negative even after historically large absolute profits.
The Q2 FY27 Earnings Scorecard
The August 26, 2026 NVIDIA newsroom release for the quarter ended July 26, 2026 gives investors a clean set of headline figures. The table below translates each one into an earnings-reading input rather than a celebration metric.
| Metric (Q2 FY27) | Reported figure | What it tells an earnings reader |
|---|---|---|
| Revenue | $96.2B / $96,221M; +18% QoQ; +106% YoY | Establishes absolute scale and sequential momentum after an already huge prior quarter |
| Data Center revenue | $89.0B; +18% QoQ; +117% YoY | Primary demand and mix signal for the AI-infrastructure thesis |
| Edge Computing revenue | $7.2B; +13% QoQ; +27% YoY | Secondary growth vector; useful context, not the main thesis carrier |
| Gross margin (GAAP & non-GAAP) | 75.0% | Confirms pricing power and mix quality after cost of revenue |
| GAAP operating income | $63.734B | Shows operating leverage after $8.408B in GAAP operating expenses |
| GAAP net income | $59.688B | Converts the quarter into bottom-line earnings power |
| Diluted EPS | GAAP $2.46; non-GAAP $2.22 | Near-term earnings unit for modeling; not a live valuation claim |
| Free cash flow | $21.341B | Bridges reported profit to cash generation after capex-related outflows |
| Shareholder returns | ~$26.0B returned; ~$99.0B buyback authorization remaining | Confirms capital-return capacity and per-share support |
| Q3 FY27 outlook | Revenue ~$108.0B ±2%; GM 74.0% ±50 bp; no China Data Center compute assumed | Sets the next expectation hurdle and discloses a key geographic assumption |
The point of the scorecard is discipline. Revenue growth without margin support would weaken the quality of the beat. Margin strength without Data Center growth would leave the AI thesis thinner. Guidance without transparent assumptions would make the next quarter harder to underwrite. After Q2 FY27, NVIDIA is large enough that investors should insist on seeing those pieces together.
How to Read Revenue After a $96.2 Billion Quarter
Percentage growth still matters, but absolute dollars now do more of the interpretive work. An 18% sequential increase on a base already above $80 billion is a different economic event from the same percentage move earlier in the cycle. The year-over-year jump of 106% remains extraordinary, yet the sequential print is often the cleaner tell for whether demand is still accelerating into the next quarter.
Investors should also ask what kind of revenue they are reading. NVIDIA’s Q2 release ties the growth narrative to AI factories, accelerated computing, and platform transitions such as Vera Rubin entering a full manufacturing ramp. That product context helps explain why demand can stay elevated, but it does not replace the financial test. The financial test is whether revenue growth remains broad enough and profitable enough to support the next guide.
Another practical habit is to separate “beat versus prior quarter” from “beat versus what the market needed.” After a print this large, the stock can still struggle if investors decide the easy part of the growth curve is behind the company. That is not an argument against the quarter. It is an argument for reading revenue as both evidence and expectation fuel.
Data Center Versus Edge Computing in the Earnings Read
Most of NVIDIA’s equity premium lives or dies in Data Center. The $89.0 billion segment print, up 18% sequentially and 117% year over year, is therefore the first place an earnings reader should linger. If Data Center slows while total revenue still looks acceptable because of mix elsewhere, the AI-infrastructure thesis has already changed even if the top line has not collapsed.
Edge Computing’s $7.2 billion contribution, up 13% quarter over quarter and 27% year over year, still belongs on the scorecard. It shows that NVIDIA’s earnings base is not a single-line story. Automotive, robotics, PC, and related edge workloads can diversify the narrative over time. They should not, however, be allowed to distract from the fact that roughly nine-tenths of quarterly revenue still sits in Data Center.
For a deeper look at why that segment dominates the profit engine, see NVIDIA’s Data Center business explained. For the product-cycle evidence behind successive platforms, see the Blackwell and Rubin roadmap. Earnings readers only need enough of that context to judge whether the current Data Center print looks like platform momentum or a temporary shipment spike.
What Data Center growth still has to prove
The next proof points are continuity and mix. Continuity means sequential demand does not fall off a cliff after a historic quarter. Mix means networking, systems, and software attach remain strong enough to support premium margins as architectures change. A Data Center beat that depends on one narrow shipment window is weaker than a beat supported by multiple customer cohorts and platform layers.
Why Edge Computing still deserves a line on the card
Edge Computing will not decide most NVDA earnings reactions today. It can still change the medium-term debate if deskside AI, physical AI, or automotive platforms become more material. Keeping the line visible prevents investors from treating NVIDIA as a pure hyperscaler-capex proxy when the company is also building adjacent growth engines.
Margins, EPS and Cash: The Quality Layer
Revenue answers whether demand arrived. Margins and cash answer whether that demand was worth celebrating. In Q2 FY27, GAAP and non-GAAP gross margins both printed at 75.0%. GAAP operating expenses were $8.408 billion against more than $96 billion of revenue, leaving GAAP operating income of $63.734 billion and GAAP net income of $59.688 billion. Diluted EPS came in at $2.46 on a GAAP basis and $2.22 on a non-GAAP basis.
Those figures describe unusual earnings leverage. They also create a higher quality bar for future quarters. If gross margin slips because mix weakens, memory and packaging costs rise, or pricing power fades, the same revenue run rate would support a less generous interpretation. That is why the guided Q3 gross-margin band of 74.0% ±50 basis points deserves as much attention as the revenue midpoint.
Cash makes the quality layer concrete. Free cash flow of $21.341 billion in the quarter shows that reported profit is not stranded in working-capital theater. Capital returns reinforce the point: NVIDIA returned about $26.0 billion to shareholders in Q2 and still had roughly $99.0 billion remaining under its buyback authorization, with a $0.25 per share dividend payable October 1, 2026 to holders of record September 10, 2026. Dividends are not the thesis. Distributable cash is.
Investors comparing GAAP and non-GAAP results should keep the roles clear. GAAP grounds the economic reality. Non-GAAP can help with period-to-period comparability, especially after NVIDIA’s decision earlier in fiscal 2027 to stop excluding stock-based compensation from its non-GAAP measures. Neither print should be treated as a substitute for reading cash flow and margin sustainability together.
Guidance Is the Next Earnings Test
Management’s Q3 FY27 outlook is the bridge from the reported quarter to the market’s next reaction function. Revenue is expected at about $108.0 billion ±2%. GAAP and non-GAAP gross margins are expected at 74.0% ±50 basis points. GAAP and non-GAAP operating expenses are expected at about $9.2 billion and $9.0 billion, respectively. NVIDIA is not assuming any Data Center compute revenue from China in that outlook.
Read the midpoint as continuity, not destiny
A guided step-up from $96.2 billion toward roughly $108.0 billion says management expects sequential growth to continue after an already historic quarter. That supports the idea that Q2 was not a one-off shipment spike. It does not prove that growth will remain this strong four quarters later, and it should not be mechanically converted into a price target.
Read the China line as a perimeter
By stating that the outlook assumes no China Data Center compute revenue, NVIDIA is defining what is outside the estimate. Any recovery there would be incremental. Any disappointment in other regions, customer deployment timing, or competitive share would sit inside the core thesis and therefore matter more. Earnings readers who ignore that perimeter often misclassify upside and downside.
Read the margin band as a stress test
A move from 75.0% toward about 74.0% can still support a premium quality narrative if the mid-70s prove durable. A break below the guided band would force investors to revisit both earnings power and the multiple they are willing to pay for it. After a quarter this strong, margin maintenance is part of the earnings story, not a footnote.
A Practical Checklist for the Next NVIDIA Earnings Reaction
Before reacting to the next print, investors need a process that survives both euphoria and disappointment. The checklist below is designed for earnings interpretation after a quarter as large as Q2 FY27.
Demand and quality checks
1. Start with Data Center dollars and sequential growth before celebrating the total company percentage move.
2. Check whether gross margin stayed inside a mid-70s band through the product and cost cycle.
3. Compare GAAP and non-GAAP EPS, then verify that free cash flow and buybacks still confirm cash conversion.
4. Separate Edge Computing strength from the core AI-infrastructure thesis so diversification does not disguise a Data Center miss.
Guidance and sizing checks
5. Read guidance assumptions, especially China, before treating the revenue midpoint as a clean hurdle.
6. Ask what would have to go right for the next sequential step-up to land without perfect conditions.
7. Decide in advance whether you are updating a business thesis, a valuation stance, or both.
8. Revisit position size if the expectation bar rises faster than visible duration or margin proof.
This checklist will not remove volatility around NVDA headlines. It will reduce the most common earnings mistake available after a quarter like this one: treating an extraordinary run-rate as proof that every optimistic assumption about the next year has already been earned.
Trade NVIDIA Perpetuals on edgeX - 24/7, No KYC Required
NVIDIA's story does not pause when markets close. For traders who want continuous exposure to NVDA price action without the constraints of traditional market hours, edgeX offers a decentralized alternative.
Continuous NVDA Market Access
edgeX lists NVDA/USDC perpetual futures with up to 10x leverage and no expiration date. Positions can be held as long as the thesis holds, with transparent on-chain settlement and no KYC requirement.
Institutional-Scale Execution With Self-Custody
edgeX is a decentralized exchange built for active traders who value performance and privacy. Users retain control of their funds and private keys. The platform cites $10 million of depth within a one-basis-point spread, sub-0.1-basis-point slippage on larger trades, and 100% trading-fee rewards through its Trade-to-Earn program.
Know the Risks Before Trading
Leverage can amplify gains and losses, including the risk of liquidation. Traders should verify current funding, fees, liquidity, product availability and contract specifications before opening a position. Explore NVDA/USDC perpetual futures on edgeX to see what decentralized derivatives trading looks like at institutional scale.
Frequently Asked Questions
These questions address the earnings-reading issues investors raise most often after NVIDIA’s $96.2 billion Q2 FY27 print: which lines matter most, how to weigh guidance, and how to keep quality checks attached to the growth story.
Which NVIDIA earnings numbers matter most after Q2 FY27?
Start with Data Center revenue, total revenue scale, gross margin, free cash flow or capital returns, and the next-quarter guide. Those five inputs usually change the thesis faster than any single adjusted EPS curiosity.
How should investors interpret NVIDIA’s Q3 FY27 guidance of about $108.0B?
Treat it as a continuity check and an expectation hurdle. The guide implies further sequential growth and roughly mid-70s margins while assuming no China Data Center compute revenue. It is useful for near-term underwriting, not a complete intrinsic-value model.
Why separate Data Center from Edge Computing when reading the release?
Because the AI-infrastructure premium is concentrated in Data Center. Edge Computing can diversify the story over time, but a soft Data Center quarter would matter more to NVDA than an equivalent dollar miss elsewhere.
Do GAAP or non-GAAP results matter more for NVIDIA earnings analysis?
Use both. GAAP results ground the economic reality, including operating income and net income. Non-GAAP EPS can help with comparability, but cash conversion and margin durability still decide whether the print deserves a premium interpretation.
What would make a future NVIDIA earnings print look weaker even if revenue stays large?
A break in the mid-70s margin band, a sequential stall in Data Center, weaker cash conversion, or guidance that only works under perfect geographic and supply assumptions. Absolute revenue can remain historically high while the quality of the beat deteriorates.

