Nvidia Technicals: Buyers Test the All-Time High as Key Support Holds
Key Takeaways
- •Nvidia traded up $2.70, or 1.12%, at $231.00, coming within about $2 of its all-time high of $236.54 despite weaker broader US indices.
- •The swing level near $228.40 is the pivotal short-term level; holding above it keeps buyers in control, while breaking below would weaken the bullish bias.
- •A break above the record high would place Nvidia in uncharted territory, where traders would rely on momentum indicators and follow-through volume rather than overhead resistance.
- •If the record high is not breached, a deeper pullback toward the rising 100-hour moving average near $220 is possible, with a break below it favoring sellers.
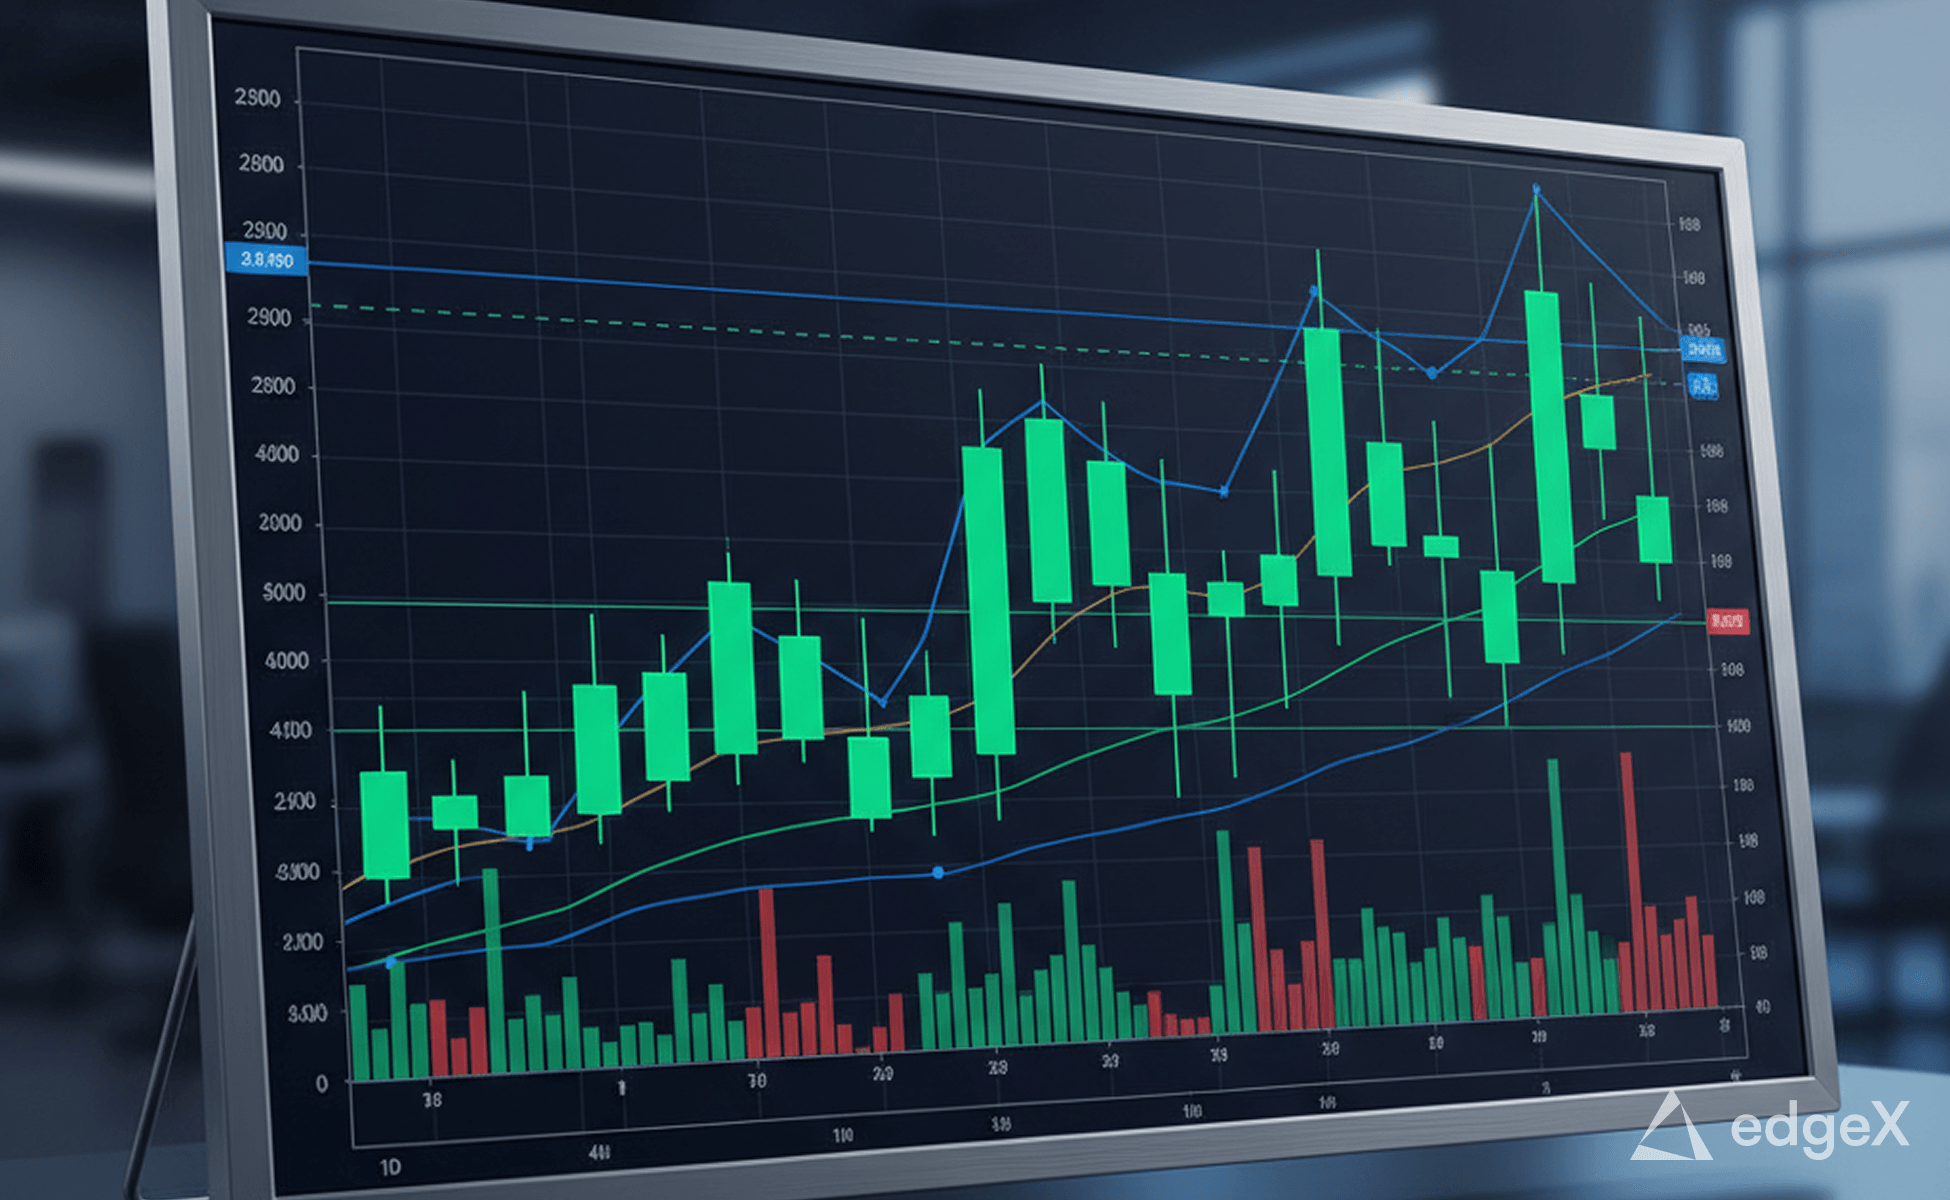
Nvidia's share price is stretching toward its all-time high even as broader US stock indices trade lower on the day. The stock is currently up $2.70, or 1.12%, at $231.00, after an intraday high of $234.76 left it less than $2 away from its record high of $236.54. The relative strength is notable given Nvidia's weight in major US indices, where its moves often influence broader market direction rather than simply following it.
From a technical standpoint, the proximity of the all-time high combined with broader market weakness has placed a temporary lid on the rally. Even so, the intraday correction found support near a swing area around $228.40 despite the weakness in the wider stock market.
That $228.40 level is central to the short-term bias. As long as the price holds above it, buyers remain in firm control and can continue to target the all-time high at $236.54. A break above that record would move Nvidia into uncharted territory, where traders would look for momentum and follow-through to confirm that the breakout is sustainable. Because there is no prior price history above a record high, such breakouts are typically monitored with reference to momentum indicators and follow-through volume rather than overhead resistance levels.
Conversely, a break below $228.40 with momentum would weaken the bullish bias, at least in the short term. It would also raise the possibility of a deeper rotation toward the rising 100-hour moving average near $220 if the stock fails to reach and breach the all-time high. That moving average represents a more significant test for buyers: staying above it would preserve the broader bullish structure, while a break below it would hand sellers greater control.
The most successful traders tend to analyze different markets in much the same way. The technical approach applied to Nvidia here is the same approach used for currency pairs, stock indices, oil and other commodities. The instrument may change, but the process remains the same: define the bias, identify the level that would invalidate that bias, limit the risk, and establish the next targets.
In Nvidia's case, the move above the swing area near $228.40 represented a bullish shift. Holding above that level keeps buyers comfortable and the record high within reach, while falling back below it would be the first warning that upside momentum is fading. For readers tracking what comes next, the levels to watch are straightforward: $236.54 on the upside and $228.40, followed by the 100-hour moving average near $220, on the downside.
In the accompanying video, the analyst takes a closer look at Nvidia's technical picture and explains the levels that will determine whether buyers remain firmly in control or whether sellers can force a deeper corrective move.
Source: Investinglive
