New Single-Family Home Prices Decline Further as Sales Fall and Inventory Glut Grows
Key Takeaways
- •The median price of new single-family homes fell to $398,300 in June, representing a 2.7% year-over-year decline and a 13.5% drop from the October 2022 peak.
- •Census Bureau median price data does not capture builder incentives and mortgage-rate buydown costs, meaning the effective cost to builders per home sold is higher than published figures indicate.
- •New single-family home sales declined 5.3% year-over-year to 54,000 units in June, marking the third consecutive month of year-over-year decreases and an 18% drop compared to June 2019.
- •Housing inventory rose to 491,000 units, equating to 9.3 months of supply at the current sales pace—well above the six-month level generally considered indicative of a balanced market.
- •Major homebuilder stocks have declined sharply since mid-September 2024, ranging from a 23% drop for D.R. Horton to a 51% decline for Lennar, as price cuts and incentives have compressed gross margins.
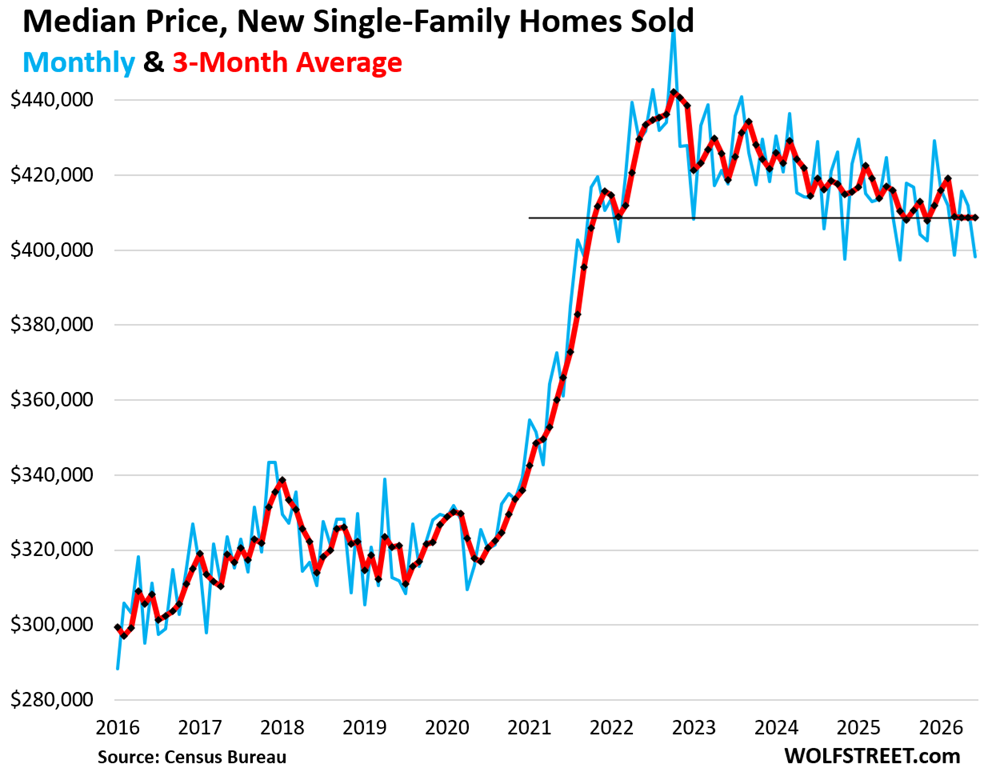
The median price of new single-family homes sold by homebuilders in June fell to $398,300, marking a 2.7% decline year-over-year, a 3.8% drop from two years ago, and a 13.5% decrease from the October 2022 peak, according to data released by the Census Bureau.
However, this median price reflects only the prices stated in sales contracts and does not account for the incentives and substantial mortgage-rate buydown costs that homebuilders employ to drive sales. Under a typical buydown arrangement, the builder pays an upfront fee to a lender to temporarily or permanently reduce the buyer's interest rate, lowering monthly payments without further cutting the headline contract price. Homebuilders do include these costs in the average selling prices reported in their financial statements, but they are not captured in the Census Bureau data, meaning the effective cost to builders per home sold is higher than the published median suggests.
The three-month average median price, which smooths out month-to-month volatility, declined by 1.7% year-over-year and by 6.7% from two years ago to $408,800 — a level first reached in October 2021.
Homebuilders remain focused on building and selling homes regardless of mortgage rate conditions or market difficulties. To protect or expand market share in the current environment, they have reduced prices, added incentives, and bought down mortgage rates. These measures have weighed on their gross margins, net profits, and share prices.
Since mid-September 2024, stocks of the largest homebuilders have declined in a range from -23% for D.R. Horton to -51% for Lennar. Lennar has pursued aggressive pricing, sacrificing a significant portion of its gross margin while gaining substantial market share. PulteGroup is the exception, with its stock down only approximately 3% over the same period. Taylor Morrison was acquired by Berkshire Hathaway earlier this year.
Sales of new single-family homes at all stages of construction fell 5.3% year-over-year in June to 54,000 homes — the third consecutive month of year-over-year declines. Compared to June 2019, sales were down 18%.
Of total sales, 67% occurred in the South and 21% in the West, combining for 88%. The remaining 12% of sales took place in the Northeast and Midwest combined.
Inventory of single-family homes at all stages of construction rose to 491,000, the third straight monthly increase — tracking both the three-month surge in mortgage rates and the three-month decline in sales.
Regionally, 61% of this inventory is located in the South (where 67% of sales took place), 21% in the West (where 21% of sales occurred), and 18% in the Midwest and Northeast combined (where 12% of sales took place).
This inventory represents 9.3 months of supply at the current sales pace, well above the six-month level that housing economists generally consider indicative of a balanced market. New additions to the U.S. housing stock are widely regarded as what the housing market needs most, and homebuilders continue to build. The challenge remains attracting enough buyers at prevailing mortgage rates.
Inventory of under-construction homes rose to 262,000 — the third consecutive monthly increase — though still down 10% year-over-year. These homes represent the construction pipeline that has not yet been sold, and homebuilders are motivated to sell them aggressively.
Inventory of completed homes for sale has been gradually declining from the elevated levels seen in December, reaching 113,000 in June. This figure was unchanged from May, still up 1% year-over-year and up 49% from 2019. These are largely move-in ready spec homes in which builders have significant capital tied up.
Inventory and Sales by Region
South: Inventory of new single-family homes for sale at all stages of construction declined 4% year-over-year to 300,000 in June but remained up 71% from June 2019. Sales were unchanged year-over-year at 36,000 single-family homes, down approximately 8% from 2019. With inventory up 71% and sales down 8% compared to 2019, the region exemplifies a supply glut.
West: Inventory of new single-family homes for sale declined 6% year-over-year and 4% from two years ago to 104,000, but remained up 22% from 2019. Sales plunged 25% year-over-year, 36% from two years ago, and 50% from 2019 to just 9,000 homes.
Midwest: Inventory jumped 8% year-over-year, 34% from two years ago, and 49% from 2019 to 55,000 new homes — matching October and November 2025 as a 16-year high. Sales came in at 7,000 (the Census Bureau rounds to the nearest 1,000).
Northeast: Inventory rose 3% year-over-year, 28% from two years ago, and 14% from 2019 to 32,000 new single-family homes. The Northeast is a smaller region dominated by densely populated cities where multifamily construction — condos and apartments — plays a larger role than single-family construction. Sales came in at 2,000 (rounded to the nearest 1,000).