Business Cycle Indicators at July's End
Key Takeaways
- •Personal consumption expenditures account for roughly 70% of US GDP, making sustained consumption growth a primary driver of the continued economic expansion.
- •The NBER BCDC determines recession onset by identifying a broad-based, persistent decline across multiple indicators rather than relying on two consecutive quarters of negative GDP growth.
- •Standard BCDC indicators include nonfarm payroll employment, real personal income excluding transfers, industrial production, and real manufacturing and trade sales.
- •Alternative indicators such as ADP payrolls, freight indexes, and real retail sales can provide earlier or more granular signals of economic turning points than the official BCDC series.
- •The Atlanta Fed's GDPNow model and the Philadelphia Fed's coincident indexes are among the tools analysts use for real-time assessment of economic activity and cyclical risk.
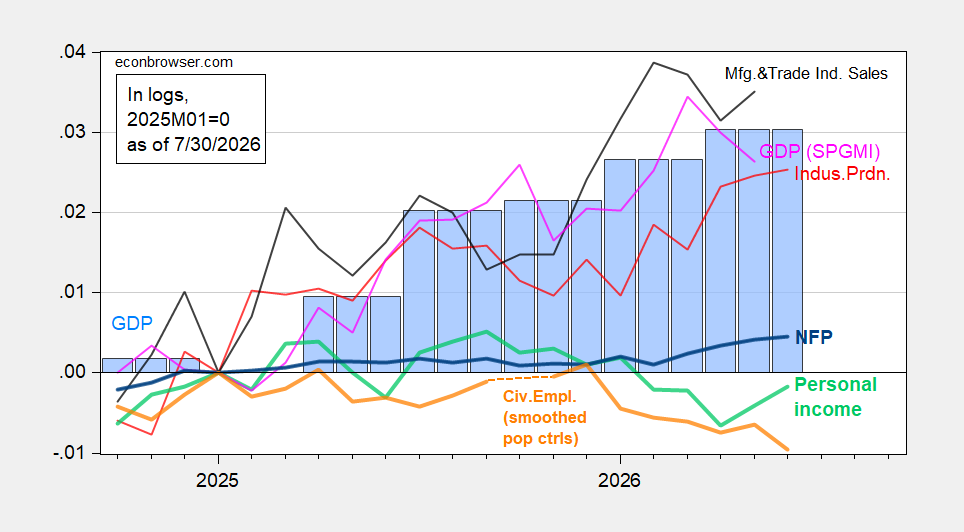
Following up on Jim's GDP assessment, the latest review of NBER Business Cycle Dating Committee (BCDC) indicators alongside alternative measures shows that consumption growth remains strong. Because personal consumption expenditures account for roughly 70% of US GDP, sustained consumption growth is a key reason the expansion has continued despite intermittent weakness in sectors like manufacturing.
The National Bureau of Economic Research (NBER) BCDC identifies business cycle peaks and troughs using a set of monthly and quarterly indicators, including nonfarm payroll employment, real personal income excluding current transfers, industrial production, and real manufacturing and trade sales. Unlike the common shorthand of two consecutive quarters of negative GDP growth, the BCDC looks for a broad-based, persistent decline across multiple indicators before declaring a recession, which is why tracking the full set simultaneously matters for assessing cyclical risk.
Figure 1: Standard BCDC Indicators and Monthly GDP
NFP employment (bold blue), civilian employment with smoothed population controls (bold orange), industrial production (red), personal income excluding current transfers in Ch.2017$ (bold light green), manufacturing and trade sales in Ch.2017$ (black), and monthly GDP in Ch.2017$ (pink), GDP (blue bars), GDPNow nowcast of 7/10 (light blue box), all log normalized to 2025M01=0.
Source: BLS via FRED, BLS, Federal Reserve, BEA 2026Q1 advance release, S&P Global Market Intelligence (formerly Macroeconomic Advisers, IHS Markit) (7/1/2026 release), and author's calculations.
Figure 2: Alternative Indicators
Civilian employment adjusted to NFP concept with smoothed population controls, using experimental controls for 2025 (bold orange), manufacturing production (red), ADP private nonfarm payroll employment (light green), real retail sales, CPI deflated (black), freight services indexes (brown), and coincident index in Ch.2017$ (pink), GDO (blue bars), all log normalized to 2025M01=0.
Source: BLS, ADP via FRED, Philadelphia Fed, Bureau of Transportation Statistics, Federal Reserve via FRED, BEA 2026Q1 3rd release, and author's calculations.
The GDPNow model, maintained by the Federal Reserve Bank of Atlanta, provides a real-time nowcast of GDP growth using available source data as it is released throughout the quarter. The coincident indexes from the Philadelphia Fed combine state-level indicators into a single measure of economic activity, while gross domestic output (GDO) represents an average of GDP and gross domestic income (GDI), offering a more comprehensive read on economic output by incorporating both the expenditure and income sides of the national accounts. The alternative indicators in Figure 2—such as ADP payrolls, freight indexes, and real retail sales—can provide earlier or more granular signals of turning points than the standard monthly series, which is why analysts monitor them alongside the official BCDC set.

