Litecoin Breaks July Descending Trendline as Key Pullback Zones Come Into Focus
Key Takeaways
- •Litecoin has broken above both the May horizontal high and the descending trendline that had capped rallies since July on its daily chart.
- •The daily RSI has moved above 70, marking an unusually fast advance that often brings wider intraday swings but does not by itself signal a reversal.
- •The 23.6% Fibonacci retracement near $66.6 is the nearest reference level below the latest high and a limited giveback would keep Litecoin in the upper part of its new range.
- •The $61–$64 range is the key retest zone, where the former descending trendline, the July horizontal high, and the 38.2% Fibonacci retracement near $61.40 converge.
- •Sustained daily closes below $61 would break down the retest case, while a recovery from the $61–$64 zone on a closing basis would strengthen the breakout's credibility.
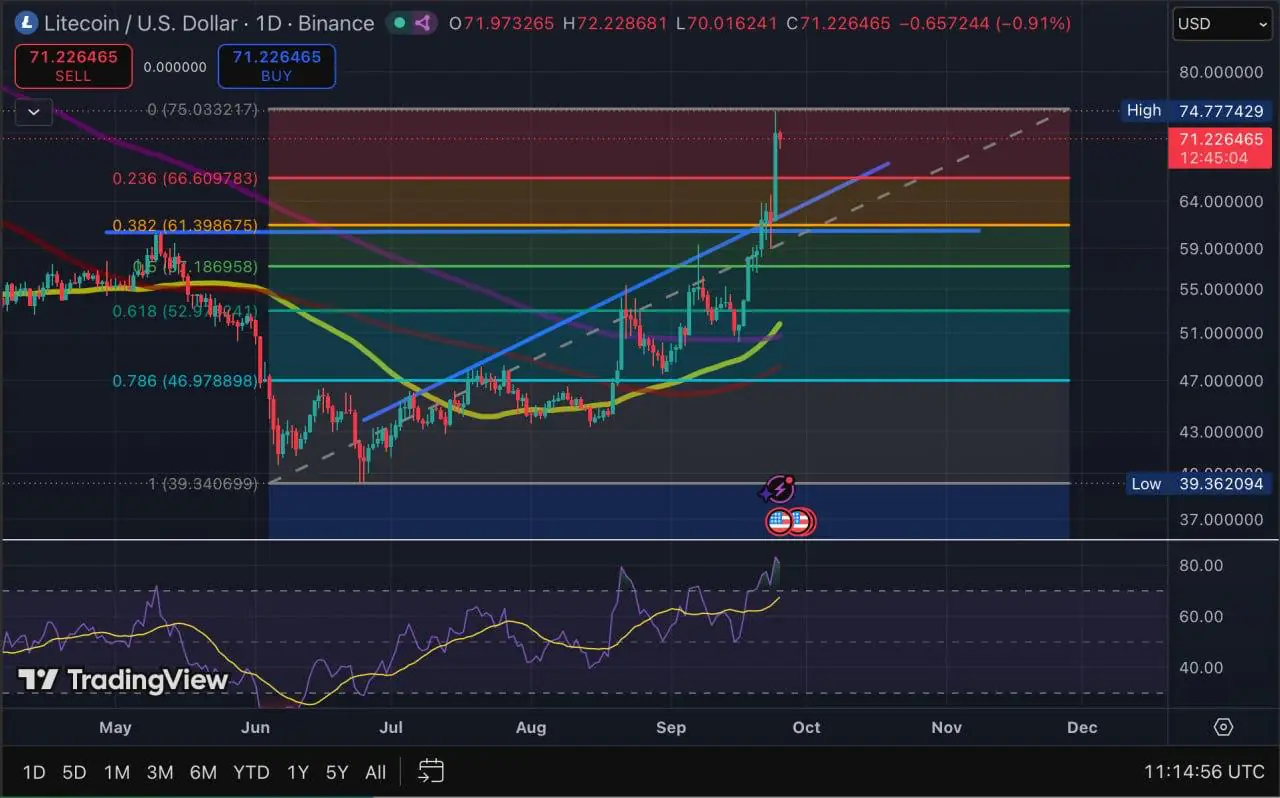
Litecoin (LTC), a peer-to-peer cryptocurrency launched in 2011 as a fork of Bitcoin, has cleared two distinct forms of resistance on its daily chart: the horizontal high recorded in May and the descending trendline that had capped rallies since July. While the breakout does not settle the longer-term trend, it gives the daily chart a structure materially different from the one that governed the summer.
The move follows an earlier analysis of Litecoin's 20% jump, which examined the rally as it developed. The focus here is narrower: how LTC behaves if price returns to the levels it has just reclaimed.
Daily RSI has moved above 70, indicating that the advance has become unusually fast. The Relative Strength Index is a momentum indicator that scores the pace of recent price changes on a scale from 0 to 100, with readings above 70 conventionally labeled as overbought. Such readings often coincide with wider intraday swings. They do not, however, establish a reversal point — which is why the market's response at the chart's support layers matters more than the first red candle.
Three layers sit below the latest high
The Fibonacci retracements referenced below are fixed-percentage reference levels derived from ratios of the Fibonacci sequence; analysts use them to gauge how much of a prior move may be given back.
1. Near $66.6: a shallow retracement
The 23.6% Fibonacci retracement sits near $66.6. It is the nearest reference below the latest high and would represent a limited giveback of the recent advance. Holding in this area would keep Litecoin in the upper part of its new range, without yet testing the levels that previously stopped price.
2. Between $61 and $64: the actual retest zone
This wider area carries weight because three separate references converge within it: the former descending trendline enters the zone, the July horizontal high lies nearby, and the 38.2% Fibonacci retracement sits near $61.40. None of these signals carries the argument alone. Together, they make $61–$64 the area where the breakout can be properly tested.
A pullback into that range would not erase the advance. The key question is whether price regains the upper part of the zone on a daily closing basis — a sign that the former barriers are starting to operate as support rather than resistance.
3. Sustained trade below $61: the retest breaks down
Daily acceptance below the lower edge of the confluence zone would remove the clean retest case. LTC would then be trading beneath the Fibonacci level, the nearby July reference and the trendline area at the same time. A single intraday wick would not settle that question; the close and the next day's response would.
The close matters more than the first dip
Fast moves often produce sharp retracements, particularly once momentum indicators become stretched. Not every move below the recent high should therefore be read as a failed rally. The daily close shows where the market was willing to finish the session, while the follow-through reveals whether that response has held.
For Litecoin, $66.60 is the first signpost beneath the market, while the $61–$64 range carries the real structural weight. A recovery after a test there would give the breakout more credibility; failure to reclaim it would leave the chart without its strongest new support cluster.
A return toward $61–$64 is therefore a test, not a verdict. The distinction becomes clear only once Litecoin either holds the zone and moves back above it, or begins closing beneath it without a recovery.
This article is provided for informational purposes only and does not constitute financial or investment advice. Cryptocurrency prices are volatile, and technical levels can change quickly.
Source: Coindoo

