Private Sector Adds 30,000 Jobs in July as Local Governments Shed 57,000; Labor Force Continues to Shrink
Key Takeaways
- •U.S. total nonfarm payrolls fell by 23,000 in July, driven primarily by a 57,000 decline in local government employment, while private sector payrolls grew by 30,000 jobs.
- •The federal government has eliminated 327,000 positions since January 2025 as part of a broad workforce reduction initiative involving deferred resignations, reductions in force, and agency reorganizations.
- •The labor force shrank by 264,000 people in July to 169.09 million, marking a 1.32 million contraction over the past year due to immigration crackdowns and baby boomer retirements.
- •Leisure and hospitality lost 40,000 jobs in July, the largest decline among private sector categories, after being a leading source of post-pandemic employment growth.
- •Year-over-year wage growth of 3.2% now falls below CPI inflation of 3.5%, reversing three years of real wage gains and reducing workers' purchasing power.
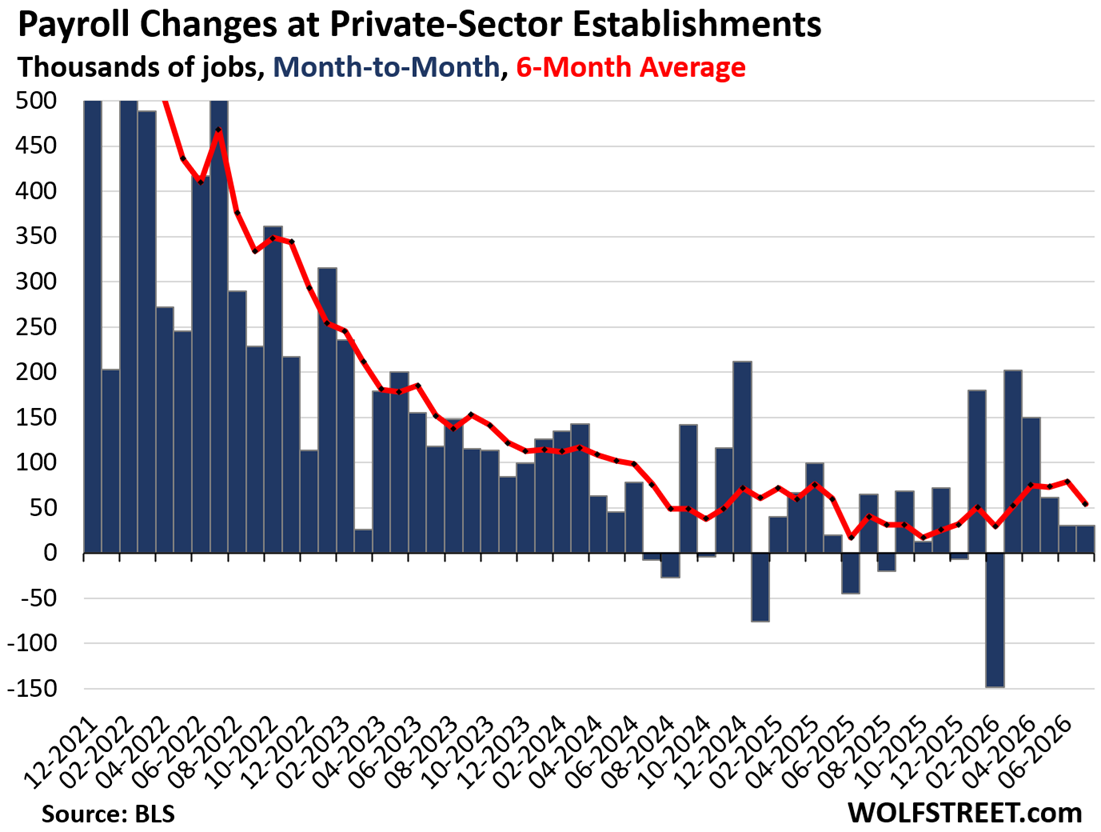
Total nonfarm payrolls in the United States fell by 23,000 jobs in July compared to June, as local government employment posted its largest monthly decline in years. However, private sector payrolls continued to expand, gaining 30,000 jobs — matching the prior month's increase — to reach 135.59 million, according to data released by the Bureau of Labor Statistics.
The six-month average for private sector job gains, which smooths month-to-month volatility, dipped to 54,000, a fraction of the monthly gains that routinely exceeded 200,000 through much of 2022 and 2023.
Private Sector Job Changes by Category
Three major private-sector categories reported job losses:
- Leisure and hospitality: -40,000
- Retail trade: -19,000
- Financial activities: -14,000
Leisure and hospitality, which had been among the strongest engines of post-pandemic job growth, shed the most positions of any private-sector category in July.
All other major private-sector categories added jobs, including the two segments where many technology companies reside — Information and Professional and Business Services:
- Construction: +22,000
- Manufacturing: +5,000
- Information: +11,000
- Professional and business services: +18,000
- Healthcare: +22,000
- Wholesale trade: +5,000
- Transportation & warehousing: +10,000
- Other services: +9,000
Healthcare's continued expansion reflects a long-running structural demand trend, as the sector benefits from demographic aging and sustained need for medical services.
Government Employment Trends
Total nonfarm payrolls were dragged down by losses in local government (-57,000) and federal government (-3,000). State governments added 7,000 jobs, marking their first gain in many months.
Since January 2025, all levels of government combined have shed a net 166,000 jobs:
- Federal government: -327,000
- State government (largely higher education, including state universities): -54,000
- Local government (largely education and first responders): +94,000
The federal government's reduction of 327,000 positions coincides with the current administration's broad initiative to shrink the federal workforce through deferred resignation programs, reductions in force, and agency-level reorganizations.
The six-month average gain for total payrolls declined to 44,000 in July. Total nonfarm employment dipped to 158.86 million, driven primarily by the reduction in government positions.
Labor Force Continues to Contract
The labor force — defined as people who are working or actively seeking work — dropped by another 264,000 people in July to 169.09 million, its lowest level since the substantial upward revision in January 2025 that incorporated several years of immigration data.
Over the past 12 months, the labor force has contracted by 1.32 million people. By contrast, in the years before the pandemic, the labor force typically grew by approximately 1 million to 2 million annually. A shrinking pool of available workers can constrain the economy's capacity for growth, as GDP expansion depends on either adding workers or raising the output each worker produces.
The ongoing reduction is attributed to two principal factors: the crackdown on illegal immigration and the continuing wave of baby boomer retirements.
Unemployment and Participation
The number of unemployed people fell to 6.92 million in July, the lowest since January 2025. The unemployment rate declined to 4.09%, also the lowest since January 2025. The rate is calculated as the number of unemployed individuals actively seeking work (6.92 million) divided by the total labor force (169.09 million) — both figures having declined.
Within a 50-year timeframe, the current unemployment rate remains low, largely due to the shrinking supply of labor.
The prime-age labor force participation rate, covering individuals aged 25 to 54, ticked up to 83.4% in July following a decline in June. The three-month average stood at 83.5%. Both figures represent the highest levels in over two decades.
The prime-age metric excludes the effect of retiring boomers. When individuals retire and stop seeking employment, they are no longer counted as participating in the labor force but remain part of the population. The surge in boomer retirements over the past 15 years has been a key factor pushing down the overall labor force participation rate.
Wage Growth
Average hourly earnings rose by 0.05% in July from June and by 3.2% year-over-year. With CPI inflation running at 3.5%, the 3.2% wage gain now trails inflation, after outpacing CPI inflation during the previous three years. The reversal means that, on average, workers' paychecks are losing purchasing power in real terms. Consumer spending accounts for roughly two-thirds of U.S. GDP, and real wage trends are a key input into household spending capacity.
