Existing Home Sales Fall Again in July as Supply Reaches Multi-Year Highs
Key Takeaways
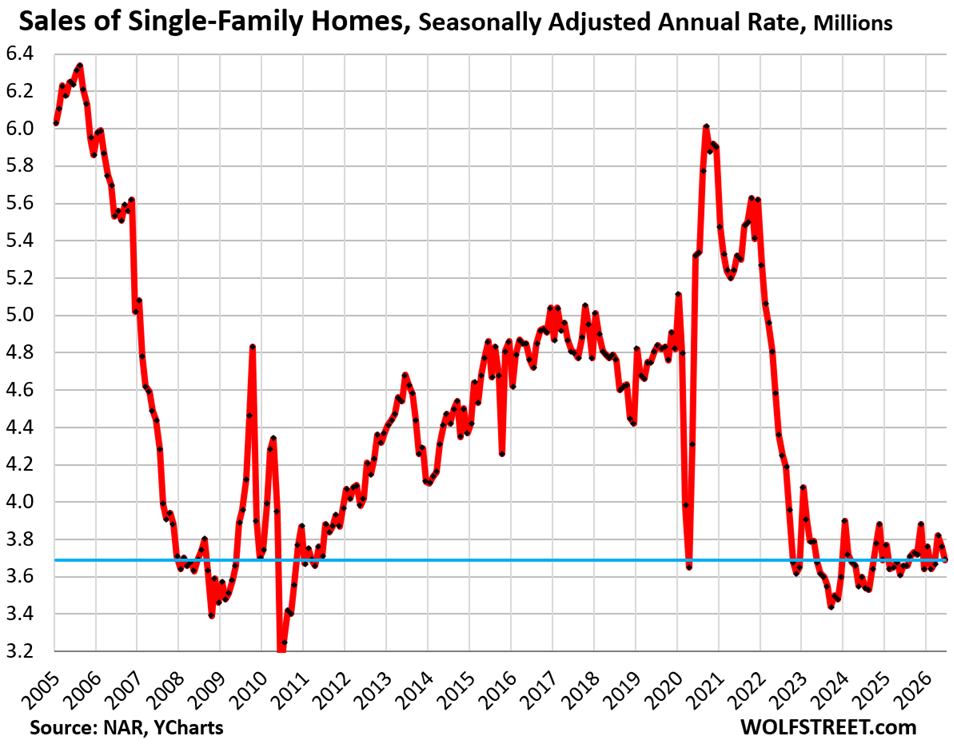
- •Existing single-family home sales fell 1.9% month-over-month in July to a seasonally adjusted annual rate of 3.69 million, marking the second straight monthly decline.
- •Single-family housing supply rose to 4.6 months in July, the highest level since 2016, as inventory increased to 1.4 million homes amid stagnant sales.
- •The national median single-family home price increased 1.9% year-over-year to $440,300, but prices declined 10% to 26% in fifteen larger markets including Austin, Oakland, and New Orleans.
- •Since late 2022, cumulative CPI inflation of 13.2% and wage growth of 16.9% have outpaced the 4.6% gain in national median home prices, gradually easing the affordability crisis.
- •Condo and co-op sales remained unchanged at an annual rate of 370,000—just above the series record low—with supply reaching 6.6 months, the highest since 2012, as Sun Belt and Florida markets face rising insurance and HOA costs.
Mortgage rates at 6.69% are not high. Inflation is high.
Sales of existing single-family homes fell 1.9% in July from June on a seasonally adjusted basis, marking a second straight monthly decline and bringing the annual rate to 3.69 million sales, according to data released today by the National Association of Realtors. Sales remained deep in the low range they have occupied for four years. That range took hold after the Fed's rate hikes began in 2022 and has persisted even as the economy has continued to add jobs, underscoring how the lock-in effect — homeowners reluctant to give up mortgages locked in at 3% or below — continues to constrain both supply and turnover.
Compared with July in prior years:
2025: +0.8% (year-over-year)
2024: +2.5%
2023: +1.9%
2022: -15.4%
2021: -30.6%
2019: -23.3%
2015: -24.1%
2009: -5.1% (Housing Bust)
1996: -3.7%
Supply of single-family homes rose to 4.6 months in July, the highest level since the summer of 2016. Supply reflects the relationship between inventory and sales. As sales weakened further, inventory increased to 1.4 million single-family homes for sale. Rising inventory alongside stagnant sales is a combination that has historically shifted bargaining power toward buyers, though the effect on prices has varied sharply by market.
Sales of condos and co-ops were unchanged in July on a seasonally adjusted basis and rounded to the nearest 10,000, at an annual rate of 370,000. That figure was just above the record low in the data series, which begins in late 2011.
Compared with July in prior years:
2025: 0% (year-over-year)
2021: -47.9%
2019: -36.2%
2012: -27.5% (first June in the data series)
Supply of condos rose to 6.6 months, matching May, June, and September 2025 and reaching the highest level since 2012. The condo market has been under particular pressure in Sun Belt and Florida markets where investor-heavy purchases during the pandemic have given way to elevated insurance costs and HOA fee increases.
Sales by region
Sales of existing homes, including single-family homes, condos, and co-ops, declined month-to-month in the South (-3.1%) and the Midwest (-2.0%), both for a second consecutive month, on a seasonally adjusted basis. Sales were unchanged in the West and increased in the Northeast by 2.0%.
Compared with the same month in 2019, sales were lower in every region: West (-37%), Northeast (-27%), Midwest (-24%), and South (-19%). A map of the four regions appears below the article at the top of the comments.
In the South, the seasonally adjusted annual rate of sales fell 3.1% in July from June, for a second consecutive monthly decline, to 1,860,000 homes.
Compared with July in prior years:
2025: 0% (year-over-year)
2024: +2.8%
2023: 0%
2022: -14.3%
2019: -19.1%
2018: -17.3%
In the West, the seasonally adjusted annual rate of sales was unchanged in July at 730,000 homes.
Compared with July in prior years:
2025: +1.4% (year-over-year)
2024: -2.7%
2023: -1.4%
2022: -17.0%
2019: -36.5%
2018: -38.7%
In the Midwest, the seasonally adjusted annual rate of sales fell 2.0% in July to 970,000 homes.
Compared with July in prior years:
2025: +2.1% (year-over-year)
2024: +4.3%
2023: 0%
2022: -19.2%
2019: -23.6%
2018: -23.6%
In the Northeast, the seasonally adjusted annual rate of sales rose 2.0% to 500,000 homes.
Compared with July in prior years:
2025: 0% (year-over-year)
2024: +2.0%
2023: +4.2%
2022: -20.6%
2019: -26.5%
2018: -27.5%
Mortgage rates are not high; inflation is high.
The average 30-year fixed mortgage rate rose to 6.69%, according to Freddie Mac's weekly measure last Wednesday.
Mortgage rates generally track the 10-year Treasury yield, which stood at 4.69% at the moment, though mortgage rates are higher and the spread between the two varies. Inflation has remained elevated, amid concerns that it is not returning to lower levels, which is one reason the 10-year Treasury yield is at 4.69%.
Current mortgage rates are at the lower end of the range seen before the Federal Reserve's QE began in 2009. That program involved purchases of trillions of dollars of mortgage-backed securities to suppress mortgage rates and support home prices.
During the pandemic, mega-QE helped push mortgage rates below 3% while inflation was rising toward 9%, leaving mortgage rates deeply negative in real terms after adjusting for inflation. Combined with FOMO among homebuyers seeking to lock in those rates, that helped fuel the surge in home prices from mid-2020 to mid-2022. The Fed's money-printing strategy ultimately contributed to the current affordability crisis and to high inflation.
We have been saying this for years: the housing market — buyers, sellers, and everyone in between — needs to get used to these mortgage rates.
National price, local price, inflation, and wage increases
The national median price of single-family homes edged up 1.9% year-over-year in July, not seasonally adjusted. On a month-to-month basis, it declined to $440,300.
Since late 2022, broad inflation and national wage growth have outpaced increases in the national median price of single-family homes, easing the affordability crisis only very gradually over many years after the 40% surge in the national median price over the two years through mid-2022, which followed already elevated home prices.
The price surge ended in June 2022. Over the four years since then:
National median price of single-family homes: +4.6% through July.
Consumer Price Index (CPI): +13.2% through June.
Average hourly earnings: +16.9% through July.
But the national median price is not what matters to people buying or selling a home. Local prices are what matter, and those vary widely.
Single-family home prices have declined by 10% to 26% in 15 larger markets, including:
Austin, TX: -26%
Oakland, CA: -25%
New Orleans, LA: -20%
Sarasota County, FL: -17%
In some other larger cities, single-family home prices have continued to set new highs. The biggest year-over-year gains in those cities were in:
New York City: +4.1%
Chicago: +4.4%
Milwaukee: +3.6%
The divergence between markets that surged on pandemic-era in-migration and those with longstanding supply constraints has become a defining feature of this cycle. Markets like Austin and Sarasota that absorbed outsized demand in 2020–2022 have seen the steepest reversals, while Northeast and Midwest cities where prices rose more modestly have proven more resilient.
The national median price of condos and co-ops rose 2.2% year-over-year.
On a local basis, condo prices have fallen 15% to 33% from their highs in 30 larger markets, with several markets dropping below their 2006 peaks. From the peak:
Cape Coral, FL: -33%
Oakland, CA: -32%
Petersburg, Fl: -29%
Austin, TX: -28%
Fort Myers, FL: -27%
Sarasota County, FL: -24%
Garland, TX: -21%
Tampa, FL: -21%
Here is Oakland, for example. The national median condo price does not matter much to condo buyers and sellers in specific markets (all 30 charts are here).
In case you missed it: Another Hit to Demand in the Housing Market: Purchases by Foreign Buyers Have Plunged by 76% from Peak.
