Is Bitcoin Dead? Strike CEO Jack Mallers Points to Its History
Key Takeaways
- •Jack Mallers argued on the November 17 episode that Bitcoin's earlier crashes, from Mt. Gox in 2014 to FTX in 2022, were deeper than the current decline, which he views as a normal bear market rather than the end of the asset.
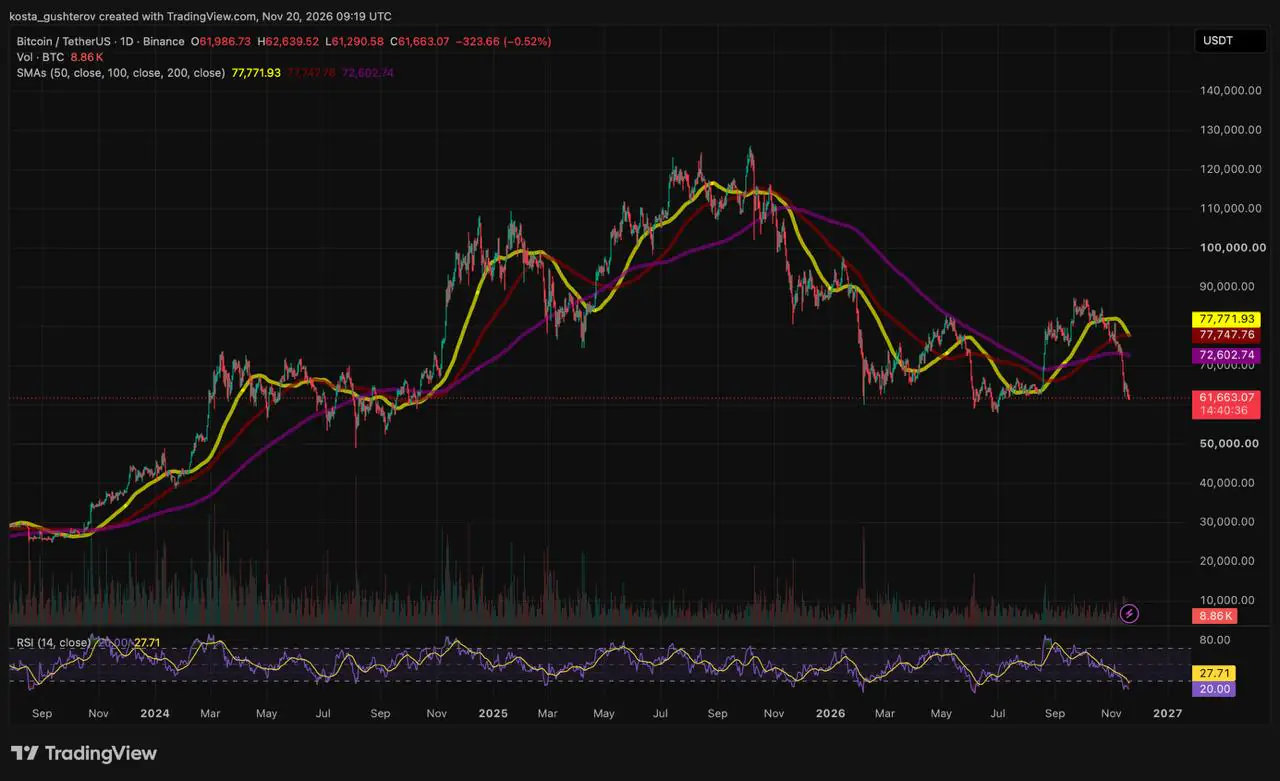
- •Bitcoin traded at $61,663 on Binance at 09:19 UTC on November 20, roughly 51% below its record above $126,000, with the 14-day RSI near 20 at levels comparable to those preceding rebounds at the February and June lows.
- •Sentiment researcher Michael Sullivan's data shows newer Bitcoin investors growing more optimistic while veterans of a decade or more turn less hopeful, a gap Sullivan says has historically appeared around market tops rather than bottoms.
- •Glassnode's November 16 Market Pulse shows the short-term to long-term holder supply ratio nearly unchanged at 15.1%, recent buyers on average at a loss, and spot ETFs continuing to record outflows, indicating sellers have not yet run out.
- •The Federal Reserve ended its securities runoff on December 1, 2025, with average securities holdings near $6.47 trillion, about $208 billion higher than a year earlier, meaning remaining liquidity pressure comes from the bond market and Treasury financing rather than the Fed.
In the November 17 edition of The Jack Mallers Show, Strike CEO Jack Mallers argued that Bitcoin's current slide looks less like an ending and more like the earlier bear markets that investors repeatedly — and wrongly — took for the end. Strike sells Bitcoin services, so Mallers benefits when demand for the asset grows.
Mallers' Case: Bitcoin Has Been Here Before
Mallers has held Bitcoin for almost 14 years, and his argument rests on that memory. Every bear market he has lived through produced the same verdict — that Bitcoin was finished. Walking through the major crashes from Mt. Gox, the Tokyo exchange that collapsed in 2014, to FTX, which failed in 2022, he notes that each of them cut deeper than the current decline. (Rounded figures from Glassnode's cycle research and exchange price histories; intraday extremes and daily closes produce slightly different percentages.)
Mallers reads the current cycle as a sign of strength rather than fatigue. Bitcoin set its October 2025 record more than 80% above its 2021 peak while the Federal Reserve was still running down its balance sheet, meaning the rally came without the flood of new money that powered 2021.
The comparison covers only the damage done so far. The earlier cycles are measured to their final lows, while the current one is 410 days old and has no confirmed low. Mallers also points out that the previous gaps between record highs ran about three years, three years and 2.3 years, which makes a year spent below the peak ordinary rather than alarming.
Where the Chart Is Testing That Claim
At 09:19 UTC on November 20, Bitcoin traded at $61,663 on Binance, roughly 51% below its record above $126,000. On the daily chart, price sits under all three of its main moving averages: about 15% beneath the 200-day average, a standard gauge of the long-term trend, at $72,603, and further below the 50-day at $77,772 and the 100-day at $77,748. Those two shorter lines are now only $24 apart and turning lower together.
Momentum is stretched. The 14-day RSI, a momentum gauge scored from 0 to 100, has dropped to around 20, a reading comparable to the ones Bitcoin printed near its February and June lows. Both times, the selling stalled and price rebounded within weeks.
That zone is the real test of Mallers' argument. February's sell-off stopped close to $60,000, and the July 1 low came in near $57,700. Price is now less than $2,000 above the top of that range, which would make this the third visit of the year. Daily closes holding inside it would give his history lesson its first chart support, while a close below $57,700 would mark a new low for the cycle and push the drawdown past 54%.
Mallers also cites the slower 200-week moving average, which he places around $68,000, about 9% above the current price. By his count, Bitcoin has spent less than a tenth of its life below that line. Coindoo's November monthly-chart analysis flagged the low-$60,000 region as a structural level earlier this month.
The “Five Flat Years” Complaint Depends on the Start Date
The objection Mallers hears most often is that Bitcoin has gone nowhere in five years. He answers it by pointing out that the same complaint was true in late 2022, shortly before the price rose roughly eightfold. Two windows of the same length, one year apart, show how much the starting point decides the answer. (Figures are Coindoo calculations from year-end daily closes; nominal returns before fees, taxes or inflation.)
A buyer at the end of 2017 waited five years to make 17%. A buyer twelve months later made more than ten times their money over the same span. A five-year figure, Mallers argues, says more about when someone bought than about the asset itself.
The Warning Inside Mallers' Own Evidence
The strongest counterpoint in the episode came from a clip Mallers played himself, in the Santiment segment. In it, sentiment researcher Michael Sullivan shows newer Bitcoin investors growing more optimistic while veterans of a decade or more turn less hopeful. Sullivan says gaps this wide have historically appeared around market tops, not bottoms, and his October 29 research note tracks the same drop in veteran optimism.
Mallers adds that, by Sullivan's measures, sentiment is now worse than when Bitcoin traded near $58,000 and worse than during the March 2020 crash. Widespread fear is what most investors look for at a bottom. A split in which newcomers stay hopeful while the most experienced holders lose faith is a different picture: it suggests one group has not yet given up, and the group losing conviction is the one holding the oldest coins. Sullivan's categories track online sentiment, not wallets, so they show mood rather than actual selling.
The gloom reaches well beyond crypto. The University of Michigan's preliminary November survey, a monthly gauge of US household confidence, put consumer sentiment at 51.0, up slightly from October's 48.0 — a level Mallers notes was below the 2022 low. His slides add a separate Michigan series, the share of consumers who say higher prices left them worse off than a year earlier. He puts it at 57%, and the Bloomberg chart he shows places it at its highest level since the late 1970s.
Who Is Selling Into the Drop
New bitcoins arrive only on a fixed schedule through mining, as Bitcoin.org explains, so rising demand has to be met by existing holders willing to sell. In Mallers' view, tops form when prices climb high enough to pull long-held coins out of cold storage, the offline wallets long-term holders use, and bottoms form once that selling dries up.
Glassnode's November 16 Market Pulse shows that handover still in progress. The ratio of short-term to long-term holder supply barely moved, at 15.1% against 15.0% a week earlier, while recent buyers were sitting on losses on average and spot ETFs, funds that hold Bitcoin directly, kept recording outflows. None of those readings yet shows sellers running out.
Some of the buying that does appear is recycled. Coindoo's look at dip buying alongside dollars leaving crypto found investors rotating out of other tokens into Bitcoin rather than bringing in fresh money.
Mallers also cited new quarterly 13F filings — the holdings disclosures large institutional managers file with the SEC — showing that Wells Fargo and Paul Tudor Jones had doubled their stakes in BlackRock's iShares Bitcoin Trust. The SEC filings list about 49.58 million shares for Wells Fargo and 1.36 million for Tudor Investment, plus separate options positions. Those holdings are as of September 30, seven weeks before November's slide.
Liquidity Is Looser on Paper Than Mallers Implies
Mallers' larger explanation for the decline is tight dollar liquidity. Opening the episode at 2:48, he points to the MOVE index, a gauge of expected volatility in the Treasury market built from options prices, which he says has moved from its usual 60 to 80 range to above 100. Volatile Treasuries make weaker collateral, and that tightens financing across markets. He puts the level at which authorities have historically stepped in at around 130. On top of that, heavy refinancing of short-term government debt and the AI spending boom are competing for the same capital.
The Federal Reserve is no longer adding to that squeeze. It ended its securities runoff on December 1, 2025, halting the balance-sheet shrinkage known as quantitative tightening, and its November 19 balance-sheet release shows average securities holdings near $6.47 trillion, about $208 billion higher than a year earlier. With the Fed's portfolio growing again, the pressure Mallers describes has to come from the bond market and Treasury financing instead.
Old Fears, New Labels
Mallers argues that each bear market revives the same doubts under new names. Repeating a fear does not dismiss it, though, and each one is settled by different evidence.
| Fear | History | How it is settled |
|---|---|---|
| “Paper Bitcoin” distorts the price | First raised when CME futures launched in 2017, now aimed at ETFs | Spot versus derivatives volumes and ETF creation data |
| Something better replaces it | Once Ethereum and altcoins, now AI | Capital flows and Bitcoin's performance against rivals, which Mallers says still favours it |
| Governments ban it | China banned trading and mining in 2021; the US approved spot ETFs in 2024 | Policy, not price |
| Quantum computing breaks it | A technical risk with no precedent in past cycles | Progress on quantum-resistant signatures, which no price recovery can show |
What Would Settle the Test
Mallers is not asking anyone to trust a chart pattern. His claim is that sellers eventually run out, as they have in every previous cycle. These are the readings that would show whether that is happening this time:
- Daily closes holding between roughly $57,700 and $60,000, or breaking below them
- A move back above the 200-day average, the nearest of the three daily averages
- The short-to-long-term holder ratio stalling and recent-buyer losses narrowing
- ETF flows turning positive with new money rather than rotation from other tokens
Mallers ended the episode by telling listeners who want out to sell, because he is buying. The daily closes near $60,000 will show how many of the coins he is waiting for are still for sale.

