Bitcoin Price Forecast: BTC Slides Below $61,560 to Lowest Level Since July as Selling Pressure Persists
Key Takeaways
- •Bitcoin slid to approximately $61,558 on Friday, its weakest level since July 6, before recovering slightly to around $61,700.
- •Ethereum underperformed with a decline of more than 5% after failing to hold a recovery near $1,823, showing the sell-off is broad-based across major cryptocurrencies.
- •Bitcoin's daily Relative Strength Index has fallen to about 20, placing the asset deep in oversold territory, though such readings measure selling intensity rather than confirm a reversal.
- •A cluster of exponential moving averages between roughly $74,643 and $75,437 forms significant overhead resistance that could limit recovery attempts.
- •Key support at $61,101 remains in place, and a failure to hold that level could extend Bitcoin's decline toward the $57,000 region.
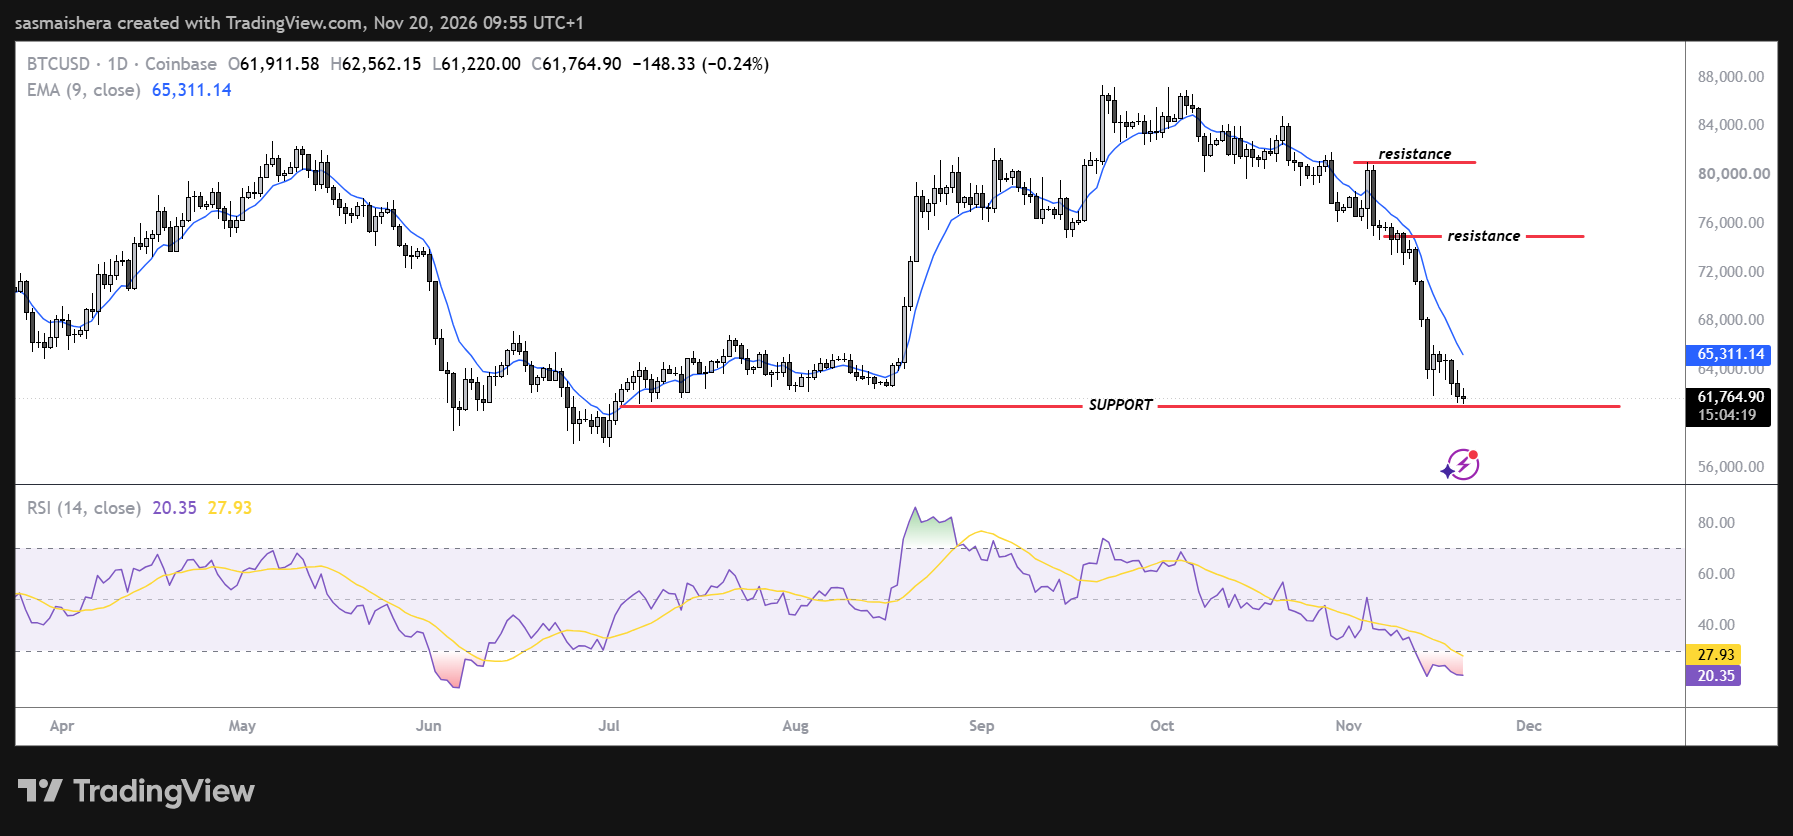
Bitcoin fell to its lowest level in more than four months on Friday, sliding to approximately $61,558 as selling pressure continued across the cryptocurrency market. The price was last recorded on July 6, and the token's weekly losses have exceeded 3%, according to CoinJournal's technical analysis.
Ethereum performed even worse over the same period, declining more than 5% after failing to sustain a recovery near $1,823. With the two largest cryptocurrencies by market value both lower over the same period, the pullback reflects broad-based selling across digital assets rather than weakness confined to a single token.
Technical indicators suggest that Bitcoin's recent sell-off may be overstretched, although the broader market structure continues to favor sellers.
Bitcoin trades at levels not seen since July
Bitcoin continued its downward trend on Friday, falling to $61,558 as the asset struggled to attract sustained buying interest. It has since recovered slightly and is trading around $61,700.
The cryptocurrency remains significantly below its major daily exponential moving averages (EMAs), reinforcing the bearish outlook. The 50-day EMA stands near $74,643, the 100-day EMA is positioned around $75,420, and the 200-day EMA sits at approximately $75,437. Together, these moving averages form a concentrated resistance region well above Bitcoin's current trading price.
The distance between BTC and its primary trend indicators suggests the market remains under considerable pressure. Until Bitcoin begins reclaiming these levels, potential recoveries are likely to be viewed as temporary rebounds rather than evidence of a sustained bullish reversal.
The absence of nearby moving-average support also leaves traders watching previous swing lows and psychological price levels for signs of renewed buying demand.
RSI drops to 20 as oversold conditions deepen
Bitcoin's momentum indicators suggest the recent decline has become increasingly stretched. The daily Relative Strength Index (RSI) has fallen to approximately 20, placing BTC deep within oversold territory. An RSI reading below 30 generally indicates that selling pressure has been unusually strong relative to recent buying activity, and a reading of 20 points to particularly aggressive selling.
Oversold readings of this kind are generally treated as a measure of existing selling intensity rather than a standalone reversal signal, since such conditions can persist while a downtrend remains in force.
The Moving Average Convergence Divergence (MACD) indicator also remains deeply negative, although its subdued histogram suggests downside momentum may be becoming less aggressive. Even so, the indicator has yet to confirm a bullish reversal. The combination of deeply oversold RSI conditions and a negative MACD suggests a temporary rebound is possible, but sellers continue to dominate the broader trend.
Key technical levels
Bitcoin faces several technical obstacles as buyers attempt to stabilize prices following the latest decline.
The first major resistance, identified by the daily moving averages, stands near $74,643, where the 50-day EMA is positioned. A sustained recovery toward this level would represent a substantial rebound from the current trading price. Beyond it, Bitcoin faces additional resistance at the 100-day EMA near $75,420 and the 200-day EMA around $75,437.
These closely grouped moving averages form a significant supply zone that could limit recovery attempts. A decisive breakout above the region would provide stronger evidence that the prevailing bearish trend is weakening. Further resistance stands near $85,000, although that level remains distant under current market conditions.
On the downside, key support at $61,101 remains in place. Failure to maintain this level could see Bitcoin extend its decline toward the $57,000 region.
Bitcoin's deeply oversold RSI suggests a temporary recovery remains possible, but the negative MACD and its position below major moving averages indicate that the broader downtrend remains intact. Against that backdrop, near-term attention is likely to center on whether the $61,101 support holds, whether the RSI can climb back toward the 30 threshold, and whether price action begins closing the gap to the EMA cluster overhead.

