Hyperliquid's HYPE rebounds from $75 support as traders watch $83 resistance
Key Takeaways
- •HYPE rose 1.9% over the past 24 hours after testing the $75–$77 support zone, where buyers previously stepped in during mid-September.
- •A move above $83 resistance would improve the short-term technical picture and could open the path to a target near $89, while a break below $75 risks a decline toward the 200-day moving average around $67.50.
- •Weekly trading volume on Hyperliquid's HIP-3 markets, which cover assets beyond crypto such as stocks and commodities, climbed about 58% from $12.4 billion to $19.6 billion, even as open interest across the blockchain fell roughly 11% from its September 13 peak of $9.1 billion.
- •CME FedWatch data shows a 9% probability of a rate increase at the Federal Reserve's upcoming meeting, while more than three-quarters of surveyed analysts expect an increase in December.
- •The Relative Strength Index stands at 39, below the neutral 50 level, indicating that sellers still hold the momentum advantage.
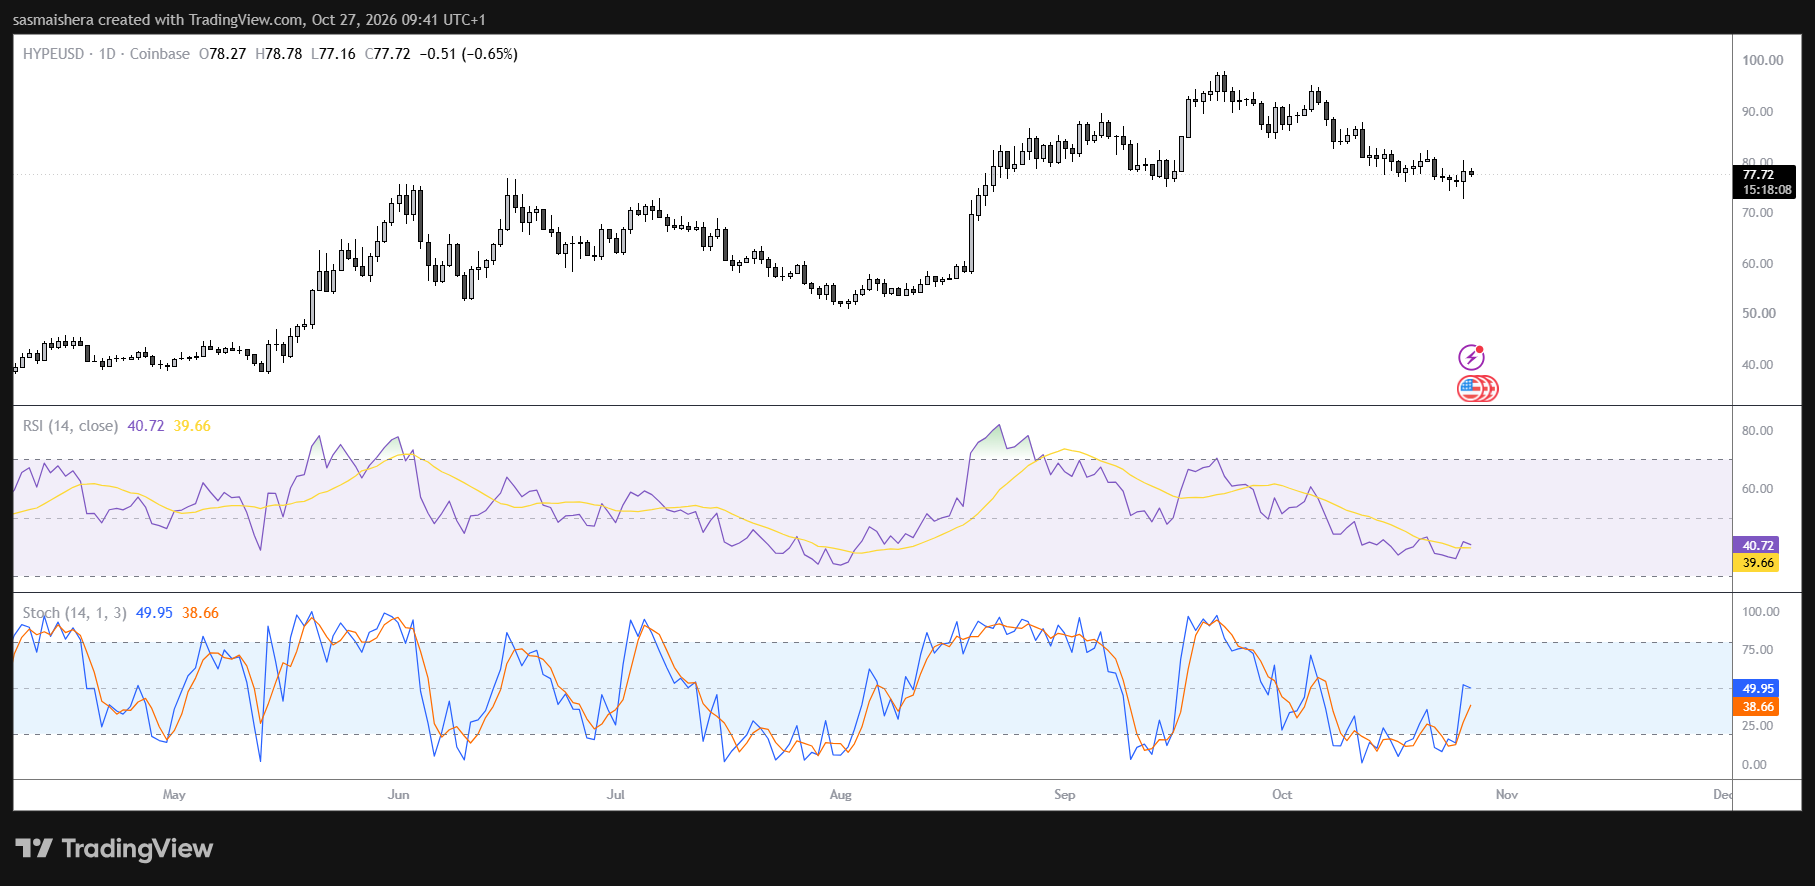
Hyperliquid's HYPE token, the native asset of the decentralized perpetuals trading platform, rose 1.9% over the past 24 hours after testing support in the $75–$77 area, giving buyers a possible opportunity to halt a correction that began in late September. The same zone underpinned the price in mid-September, before the token climbed to a record high. The latest bounce suggests buyers are again responding near that level, although a sustained recovery has yet to be confirmed.
The immediate test lies at $83. A move above that level would improve the short-term technical picture and could bring a higher target near $89 into focus. A break below $75, meanwhile, could expose the 200-day moving average, a widely watched gauge of long-term trend, near $67.50.
HIP-3 activity offers support
Trading activity on Hyperliquid's HIP-3 markets has remained relatively resilient despite a broader decline in open interest, the total value of outstanding derivative positions. Open interest across the Hyperliquid blockchain has fallen approximately 11% from its September 13 peak of $9.1 billion, while the pullback in HIP-3 markets has been milder over the past two weeks, according to the analysis cited in the report.
HIP-3 extends Hyperliquid's markets to assets beyond cryptocurrencies, including stocks and commodities, a step consistent with a broader industry effort to bring traditional assets on-chain. Weekly trading volume on those markets rose from $12.4 billion in the week ending October 4 to $19.6 billion the following week, an increase of roughly 58%, according to Hyperliquid Stats. The growth points to stronger activity in these markets, though trading volume alone does not establish how much demand it generates for HYPE.
Macro uncertainty ahead of Fed decision
The market faces potential volatility around the Federal Reserve's upcoming interest rate decision and the guidance that follows. CME FedWatch data, which derives rate expectations from the pricing of fed funds futures, shows a 9% probability of a rate increase at the meeting, while more than three-quarters of surveyed analysts expect an increase in December.
Higher inflation readings and oil prices above $100 have contributed to uncertainty about the future path of monetary policy. A more restrictive outlook could weigh on risk appetite across financial markets, including digital assets, while guidance perceived as less aggressive could provide some relief. Market-implied probabilities and analyst expectations can change quickly as new information becomes available.
Technical levels in focus
HYPE's bounce from $75 provides an initial sign of demand, but resistance near $83 remains the more consequential level for buyers. A sustained move above $83 would strengthen the case that the correction is giving way to a recovery. If momentum continues, the analysis identifies approximately $89 as a near-term target.
The Relative Strength Index, a momentum indicator that measures the pace and magnitude of recent price changes, stands at 39, below the neutral 50 level, indicating that sellers still have the advantage. The indicator is approaching its signal line, but a crossover alone would not confirm a trend reversal. Should HYPE fall below $75, the next technical support to watch is the 200-day exponential moving average near $67.50.
This article was first published by CoinJournal.

