HYPE Price Slips Below $80 as Focus Shifts to $74.5 Support
Key Takeaways
- •HYPE is changing hands near $78.2, approximately 20% beneath its September peak of about $98, after slipping under the $80 threshold that previously capped its recoveries.
- •The token's near-doubling from around $51 in late July to $98 has been followed by progressively lower bounces that carved out a falling price channel.
- •The $80 area, which served as support until mid-October, has flipped to resistance, with a heavier barrier near $86-$87 where the 50-day moving average converges with the 0.236 Fibonacci level.
- •Strong support is clustered around $74.5, where the rising 100-day average, the 0.5 Fibonacci retracement, and the channel's lower boundary come together, and the 200-day average near $64 underscores the broader uptrend.
- •Momentum is the main weak point, with the RSI reading near 38 under both its signal line and the 50 midpoint, though it has not yet entered oversold territory.
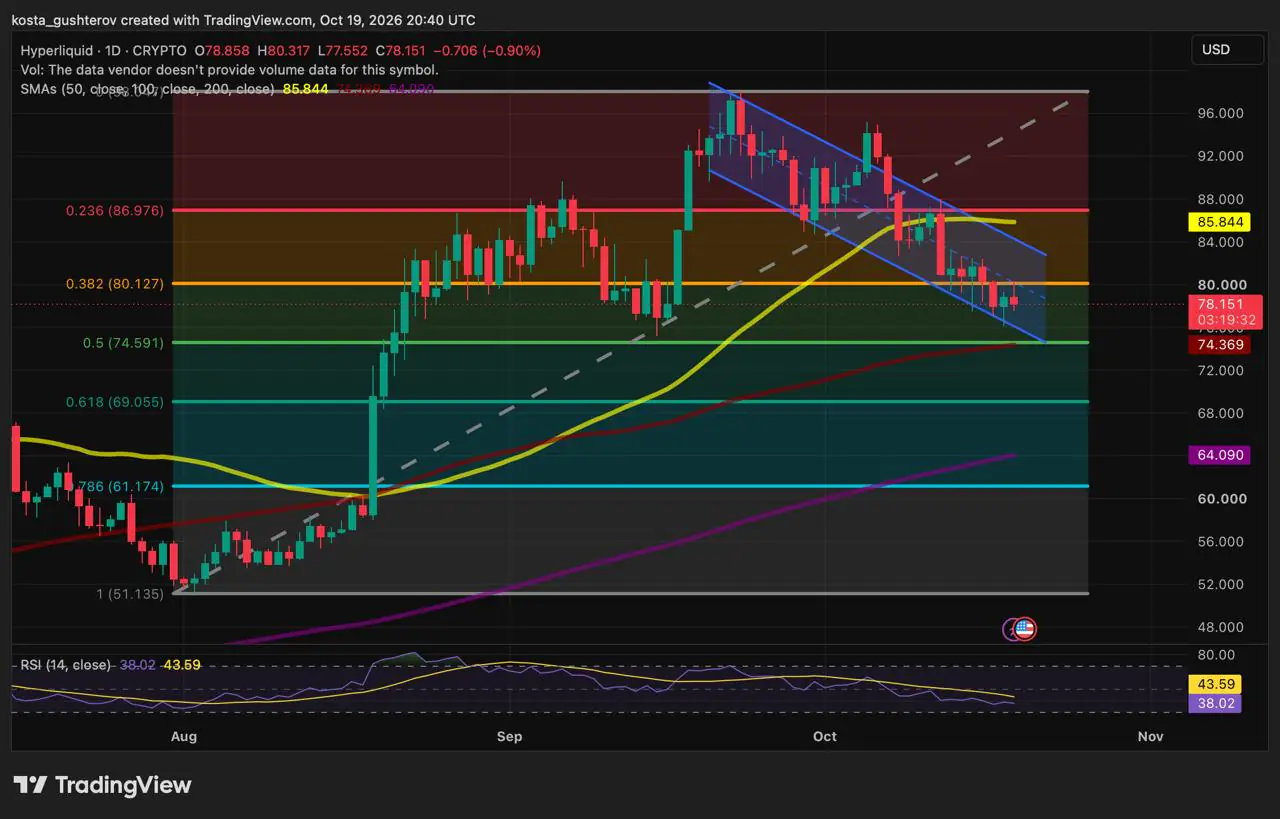
HYPE, the native token of the Hyperliquid trading platform, is changing hands near $78.2, roughly 20% below its September peak of about $98, after slipping under the $80 level that had capped its recent rebounds. For readers less familiar with the project, Hyperliquid operates a decentralized exchange on its own blockchain where users trade spot and perpetual futures markets.
Sellers Defend the $80 Line
HYPE nearly doubled between late July and late September, rallying from around $51 to $98. The pullback that followed has dragged the token back between two key Fibonacci retracement levels drawn from that move: the 0.382 level near $80 and the 0.5 level near $74.5. Fibonacci retracements are chart markers derived from the size of a prior advance that traders commonly watch for potential stalls or turnarounds.
Each bounce along the way has topped out lower than the one before it, carving out a falling channel. An early-October push toward $95 briefly broke above the channel, but sellers stepped in quickly and the slide resumed.
The $80 level has since flipped roles. It acted as support through mid-October, gave way, and on Monday it capped another rebound. HYPE wicked to about $80.3 before easing back toward $78.
Heavy Resistance Overhead
Any recovery attempt runs straight into a crowded zone near $86-$87. The 50-day simple moving average (SMA), which climbed steadily through September, has flattened around $86 and sits just beneath the 0.236 Fibonacci level near $87. The 50-day average smooths roughly the past two months of closes, making it a common shorthand for the medium-term trend.
With two major technical levels stacked that close together, this band is the toughest hurdle on the chart. It lies roughly 10% above the current price, and bulls would need to reclaim $80 first just to reach it.
Solid Support Below
The floor looks just as firm. The 100-day SMA, rising toward $74.5, has almost merged with the 0.5 Fibonacci level, and the lower edge of the falling channel is heading into the same area. That gives buyers a clearly defined zone in which to step in.
A hold there would keep the entire move a clean half-retracement of the summer rally, and the broader trend still supports that case. The 100-day and 200-day averages are climbing, the 50-day remains above both, and HYPE trades more than 20% above its 200-day SMA near $64, a long-term average frequently used as a broad gauge of trend health.
Momentum remains the weak spot. The relative strength index (RSI) sits near 38, below its signal line and under the 50 midpoint, the threshold traders use to separate bullish from bearish short-term momentum, although it has not yet reached oversold territory.
Potential Scenarios (Not a Forecast)
HYPE is boxed in between resistance near $80 and strong support near $74.5.
- Upside: A daily close back above $80 could send the price toward the $86-$87 zone, where the 50-day SMA and the 0.236 Fibonacci level meet. A break through that band would also clear the falling channel.
- Rejection: Another failure at $80 could bring the $74.5 support zone into play. Losing it on a daily close could open the way to the 0.618 Fibonacci level near $69.
- Bigger picture: As long as the 100-day and 200-day SMAs keep rising, a dip toward $74.5 would still fit within a pullback inside a broader uptrend. A drop below $69 would put the 200-day SMA near $64 in focus.
For now, $80 is the level bulls need back. A daily close above it in the coming days would put the $86-$87 zone back on the radar, while a close below $74.5 before the end of October would hand sellers control of the bigger picture.
This article is provided for informational purposes only and does not constitute financial advice. Cryptocurrency prices are volatile.
Source: Coindoo

