HYPE Back at $60: Traders Watch $59.5 Support and a Tight Resistance Cluster
Key Takeaways
- •HYPE was trading near $60 after rising above the $59.5 Fibonacci retracement level.
- •The next resistance area is around $60.1 to $60.4, where the channel ceiling and two moving averages converge.
- •A daily close above that zone would clear the 50-day and 100-day moving averages and put $62 in view.
- •Binance HYPE open interest fell about 1.5% even as price increased, indicating no fresh build-up of positions on that exchange.
- •Hyperliquid’s own perpetual market held about $1.36 billion in open interest, and its funding rate was positive, meaning longs were paying shorts.
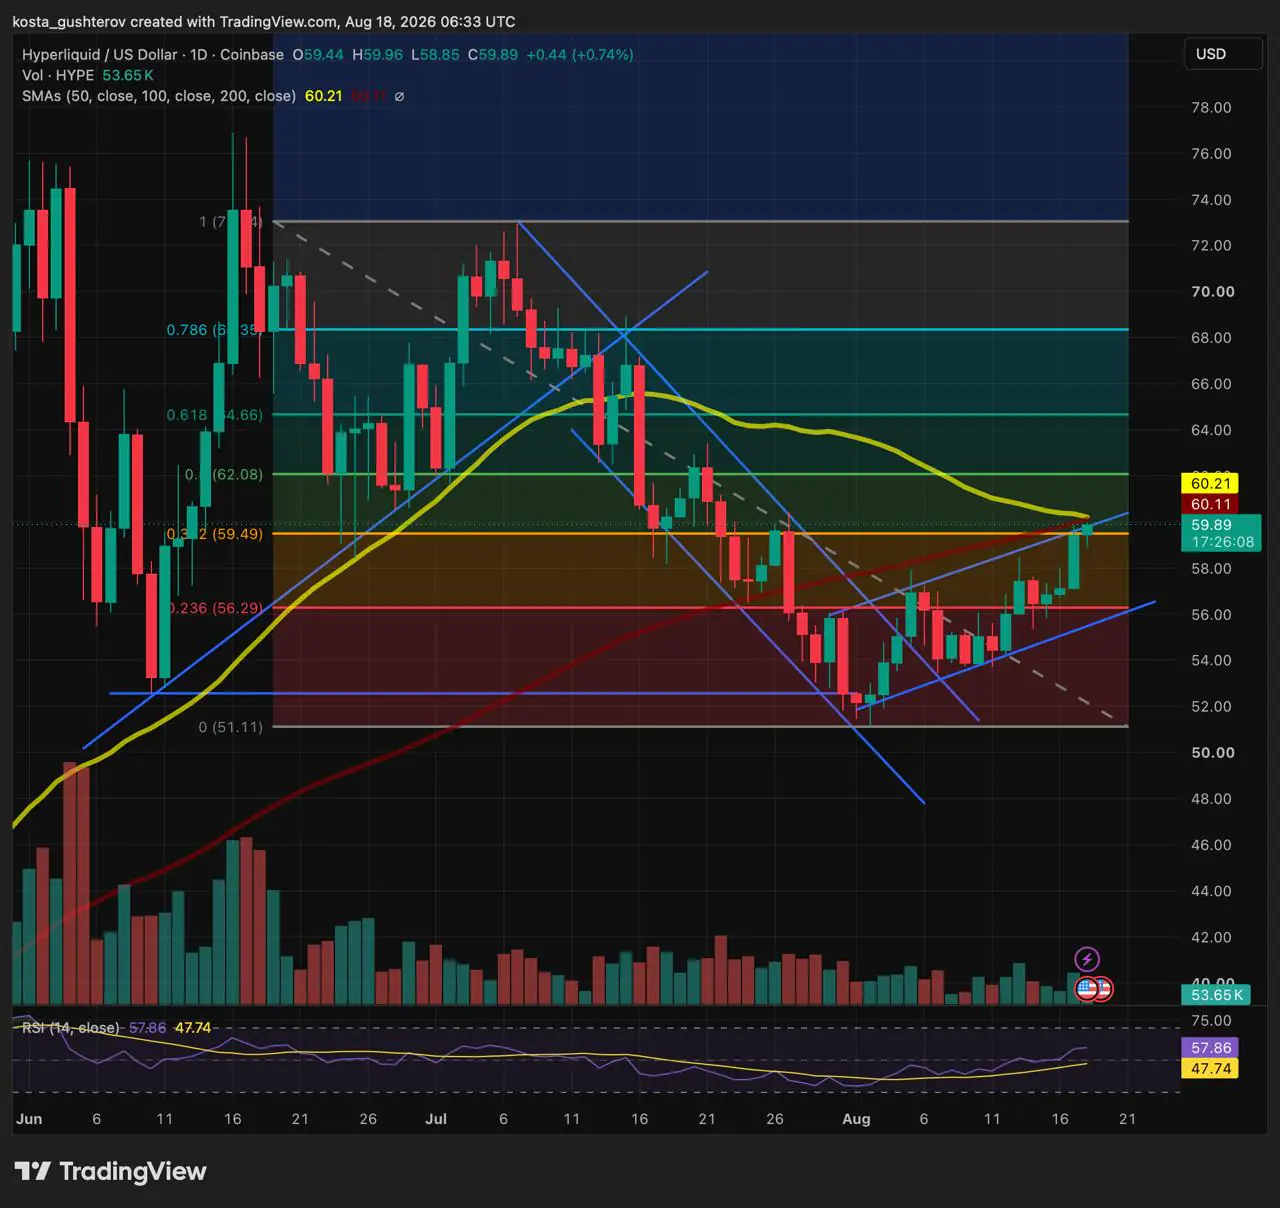
HYPE traded close to $60 across major markets at the time of writing, having pushed above the 0.382 Fibonacci retracement at $59.5. The daily chart, however, still places three nearby obstacles above the current price. The distinction that matters is simple: $59.5 now marks the level buyers need to hold, while the moving averages and the channel ceiling determine whether the recovery can continue.
Real resistance starts at $60.1
The chart measures the decline from the June high near $73 to the late-July low around $51. HYPE has already climbed through the first retracement level above that rebound, and the next cluster is tighter. The channel line is an approximate chart boundary, unlike the fixed Fibonacci and moving-average values, and its importance comes from its overlap with the two moving averages.
A daily close above roughly $60.2–$60.4 would place HYPE over the entire cluster. Until then, the move remains a recovery into resistance rather than a confirmed continuation.
Binance open interest eased as HYPE approached $60
HYPE is the native token of Hyperliquid, the layer-1 blockchain built around fully on-chain trading, and its derivatives footprint reflects that. CoinGlass listed about $2.53 billion in aggregate HYPE open interest at the time of writing, alongside roughly $1.59 billion in 24-hour futures volume and about $71.7 million in spot volume. Open interest — the total value of derivative contracts not yet closed or settled — is the standard gauge of how much capital is positioned in a market, which is why traders read it alongside price rather than in isolation.
Binance offers one useful part of the picture. HYPEUSDT traded near $60.04, up about 1.3% over 24 hours. Its open interest was worth roughly $286.7 million, compared with about $291.1 million around one day earlier — a decline of about 1.5%. The exchange therefore showed price appreciation without an expansion in open positions. The data leaves several explanations open, including short covering, long reduction and buying on other venues. It rules out a fresh build-up of Binance open interest as the immediate source of the move. Under the conventional derivatives framework, price rises on falling open interest reflect existing positions being closed rather than new money entering, while rises on growing open interest point to fresh positioning behind the move.
Hyperliquid's own perpetual market showed about 22.73 million HYPE in open interest, worth roughly $1.36 billion at the live price — more than half of the aggregate tracked total. Its latest funding rate was positive at 0.00125% per hour, meaning long positions were paying short positions during that period. Funding is the recurring payment between the two sides that keeps perpetual contract prices aligned with spot, and a positive reading indicates the long side was the one paying to hold that positioning.
The daily close now sets the near-term map
Above $60.4
A daily close above the channel ceiling would also clear the 50-day and 100-day moving averages. The next level on the chart sits at $62, the 0.5 Fibonacci retracement. The move would still need to hold above the $60 area on later candles; a return under the moving averages would keep HYPE within the same range.
Below $59.5
A loss of the 0.382 Fibonacci level would place HYPE back below the recovery pivot. The next chart area sits near $56.3, where the 0.236 retracement meets the lower edge of the channel.
That makes the near-term setup clear: $59.5 is the level buyers need to defend, while $60.1–$60.4 is the area they need to overcome. The daily close will show which side has control of the range, and the same open-interest and funding gauges will indicate whether any move beyond it arrives with fresh positioning behind it or on closing positions alone.
Market data was checked at 06:47 UTC on August 18, 2026. Technical levels come from the attached Coinbase HYPE/USD daily chart, and derivatives figures use live Binance, Hyperliquid and CoinGlass data. The analysis is for informational purposes only and does not constitute investment advice. Cryptocurrency prices are volatile, and technical levels can change quickly.
Source: Coindoo

