HELOC Balances Surge 45% Since 2021 as Mortgage Growth Stalls to Decade Lows in Q2 2026
Key Takeaways
- •Mortgage balances declined by $74 billion in Q2 2026 due to a temporary reporting gap related to a servicing transfer, while year-over-year growth of 1.4% was the smallest annual increase since 2016.
- •HELOC balances have risen 45% since the Q1 2021 trough to $459 billion, as homeowners retain low-rate first mortgages and add higher-rate second-lien credit lines instead of refinancing.
- •The housing-debt-to-disposable-income ratio fell to 57.4% in Q2, the third-lowest reading on record and far below the 90% level reached before the 2007 Mortgage Crisis.
- •Approximately 65% of all outstanding mortgages are guaranteed by the US government through agencies such as Fannie Mae, Freddie Mac, Ginnie Mae, the FHA, and the VA, shifting most mortgage credit risk from banks to taxpayers.
- •Mortgage and HELOC 90-plus-day delinquency rates both stood at 0.99%, roughly in line with pre-pandemic 2018-2019 levels, and new foreclosures remained below historical norms.
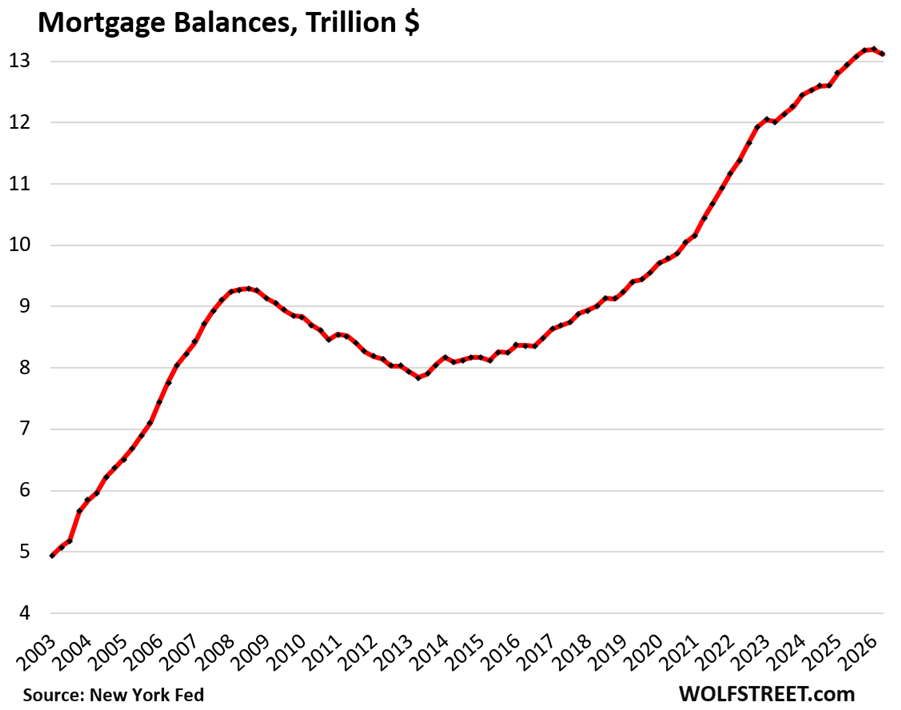
Mortgage Balances Dip on Technical Reporting Gap
Mortgage balances declined by $74 billion (-0.6%) in Q2 2026, falling to $13.12 trillion, according to the Household Debt and Credit Report from the New York Federal Reserve, which sources its data from Equifax. The New York Fed attributed the unusual drop to "a temporary gap in the reporting of mortgages on credit reports due to a transfer of servicing."
This technical reporting issue coincided with stagnation in mortgage originations, as existing-home sales continued to decline — partly a reflection of the widely documented "lock-in effect," where homeowners holding 3% mortgages are reluctant to sell and take on replacement loans at 6% or higher — and new-home sales fizzled despite aggressive incentives and price reductions from homebuilders.
On a year-over-year basis, mortgage balances increased by $187 billion, or 1.4% — the smallest annual percentage gain since 2016.
HELOC Balances Climb Sharply
Home Equity Line of Credit (HELOC) balances rose by 2.8% in Q2 and by 11.6% year-over-year, reaching $459 billion. Since the Q1 2021 trough, HELOC balances have surged 45%. These figures represent actual drawn balances and exclude unused portions of the credit lines. Rising home prices over this period have expanded homeowner equity, providing the collateral base that has enabled this drawdown.
The shift toward HELOCs reflects a straightforward calculation for homeowners seeking to extract equity. Rather than refinancing an existing 3% mortgage into a larger 6% loan, many are opting to retain their low-rate first mortgage and add a smaller HELOC at 8% or 9%. For a growing number of households, the economics have favored this approach.
A HELOC is a second-lien loan secured by the home, typically carrying a variable interest rate tied to the prime rate, meaning payments can rise if benchmark rates move higher. Default on a HELOC can trigger foreclosure and loss of the property even when the first-lien mortgage remains current, which is why these instruments add an additional layer of risk for homeowners, lenders, and the broader mortgage market. HELOCs contributed to losses during the Housing Bust and Mortgage Crisis.
Housing-Debt-to-Income Ratio Near Historic Lows
The housing-debt-to-disposable-income ratio — combining all mortgages and HELOCs against disposable income as measured by the Bureau of Economic Analysis — dipped to 57.4% in Q2. This marks the third-lowest reading on record, trailing only Q2 2020 and Q1 2021, when government transfer payments temporarily inflated disposable income.
For context, the ratio exceeded 90% in 2007 at the outset of the Mortgage Crisis.
Disposable income encompasses after-tax wages plus income from interest, dividends, rentals, farm income, small business income, and government transfer payments. It excludes capital gains, stock-based compensation, and capital appreciation.
Over time, total household income has grown faster than housing debt, as both the number of households and income per household have expanded. Consequently, the burden of housing debt relative to income has declined.
The surging debt-to-income ratio served as one of several warning signs beginning in 2004, preceding the Mortgage Crisis. Consumers had piled on housing debt amid exploding home prices, using their properties as sources of cash through refinancing and HELOCs. Housing debt grew far faster than disposable income, and the ratio climbed past 90% by 2007.
While defaults and foreclosures will always ebb and flow with economic conditions such as unemployment, a widespread mortgage crisis builds through overleverage — a condition not present in the current environment.
Delinquency Rates and Foreclosures Remain Moderate
The 90-plus-day delinquency rate for mortgages dipped to 0.99% of total outstanding mortgage balances at the end of Q2. The comparable HELOC delinquency rate edged up to 0.99% of total HELOC balances. Both figures are roughly in line with levels seen during 2018 and 2019.
These rates have risen from the near-zero levels observed during the pandemic-era forbearance programs, which effectively removed delinquency status from troubled mortgages.
New foreclosures declined to 55,160 in Q2. While foreclosures have increased from the near-zero lows of the forbearance period, they remain below the low end of the 2018–2019 range and well below historical norms.
Three factors typically drive large-scale delinquency and foreclosure waves, all of which were present during the Housing Bust:
- Overleverage — Borrowers who are not overleveraged rarely default. The current housing-debt-to-disposable-income ratio does not indicate systemic overleverage.
- Plunging home prices — Deeply underwater mortgages are a precondition for large foreclosure waves. Without a sharp price decline, distressed borrowers can generally sell the property, repay the mortgage, and potentially retain some equity.
- An unemployment crisis — During the Housing Bust, mass unemployment followed the initial crisis by a couple of years, partly as a consequence of the broader Financial Crisis.
Individual defaults occur routinely and are handled by the banking and legal systems. The associated costs are embedded in mortgage rates and fees. The issue only becomes systemically significant at a very large scale.
Who Bears the Risk? Primarily Taxpayers
Approximately 65% of all outstanding mortgages — including nearly all subprime mortgages — are guaranteed in some form by the US government. This represents one of the most fundamental structural changes to emerge from the Financial Crisis, transferring a substantial portion of mortgage risk from banks to taxpayers.
Government-sponsored enterprises (Fannie Mae and Freddie Mac) and government agencies (Ginnie Mae, the FHA, which insures low-down-payment subprime mortgages, and the VA) purchase mortgages from lenders, package them into Mortgage-Backed Securities (MBS), and sell those securities to investors. When a mortgage results in a loss, the MBS issuer absorbs the loss and makes investors whole. These "agency" MBS carry near-zero credit risk, comparable to Treasury securities.
Investors hold approximately 15% of outstanding mortgages — loans that did not qualify for government backing and were securitized as "private-label" MBS, sold to bond funds and pension funds globally.
Roughly 4,000 banks and over 4,000 credit unions hold less than 20% of total housing debt, according to Federal Reserve data. A significant mortgage meltdown would cause losses for these institutions but would not threaten the financial system in the manner seen during the last crisis.
