Gallup's October Reading Shows Decline in US Economic Confidence
Key Takeaways
- •Gallup's measure of US economic confidence showed a decline in its October reading, according to an Econbrowser analysis released ahead of the November elections.
- •The analysis places the University of Michigan sentiment series, the Conference Board Consumer Confidence Index, and Gallup's measure on a common standardized scale covering January 2021 through February 2025.
- •The University of Michigan series was adjusted using the Cummings and Tedeschi (2024) method to correct for how online interviews affect survey responses.
- •Standardizing the three gauges helps determine whether a downturn reflects a broad shift across measures or is confined to a single survey.
- •The chart includes reference lines for the April 2025 US tariff announcement, dubbed "Liberation Day," and the US-Iran war, with future releases from the three organizations expected to clarify the October decline.
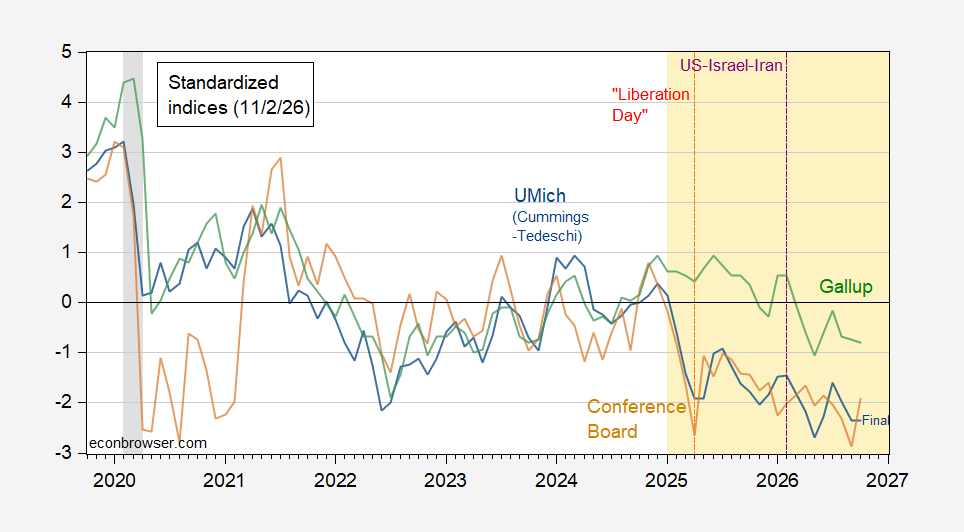
Gallup's measure of US economic confidence declined in its October reading, according to a brief analysis published by Econbrowser on the eve of the November elections.
The post centers on a single chart (Figure 1) that places three widely followed sentiment gauges on a common standardized scale: the University of Michigan economic sentiment series, adjusted using the approach of Cummings and Tedeschi (2024) to account for the effect of online interviews on survey responses; the Conference Board Consumer Confidence Index; and Gallup's confidence measure. Each series is demeaned and divided by its standard deviation over the period from January 2021 through February 2025. The standardization matters for readers because these gauges are normally reported on different scales and built from different survey questions and samples; putting them on a common footing makes it easier to tell whether a decline reflects a broad move across measures or is specific to one survey.
Two dashed reference lines mark major episodes in the chart: a red line at "Liberation Day" — the widely used shorthand for the April 2025 US tariff announcement — and a purple line at the US-Iran war.
Underlying data come from the University of Michigan, Gallup, and the Conference Board, together with the Cummings and Tedeschi (2024) adjustment and the author's own calculations.
For further discussion of consumer sentiment, Econbrowser directs readers to related commentary from Jared Bernstein.
These three gauges are among the regularly cited barometers of how US households perceive economic conditions, which is why analysts often compare them side by side rather than relying on any single survey. With the reading published just ahead of the November elections, subsequent releases from the University of Michigan, the Conference Board, and Gallup will provide the next data points for readers assessing the October decline.

