FET Price Nears $0.23 After 51% Monthly Gain and $1.56M Bridge Exploit
Key Takeaways
- •The Artificial Superintelligence Alliance disclosed on September 20 that an unauthorized party withdrew approximately $1.56 million in FET from a token converter, while treasury and exchange wallets were reported unaffected.
- •FET dropped to $0.1671 on the day of the exploit announcement, rebounded to $0.2597 by September 26, and traded near $0.234 as of October 1, 2026.
- •No verifiable evidence establishes that the exploit caused the price increase, and AI tokens rose broadly during the period, with TAO up 40%, Render up 35%, Virtuals up 19% and Bitcoin up about 8%.
- •CoinGlass heatmap data indicated the brightest liquidation bands near $0.2335, $0.2305 and $0.2258 were likely consumed when price moved through them around September 28, leaving thinner liquidity above and below the market.
- •Binance positioning data showed open interest near $33.6 million versus a 30-day peak of about $35.8 million, a taker buy/sell ratio below 1.0 from September 25 through 30, and longs declining to 63% of accounts by October 1.
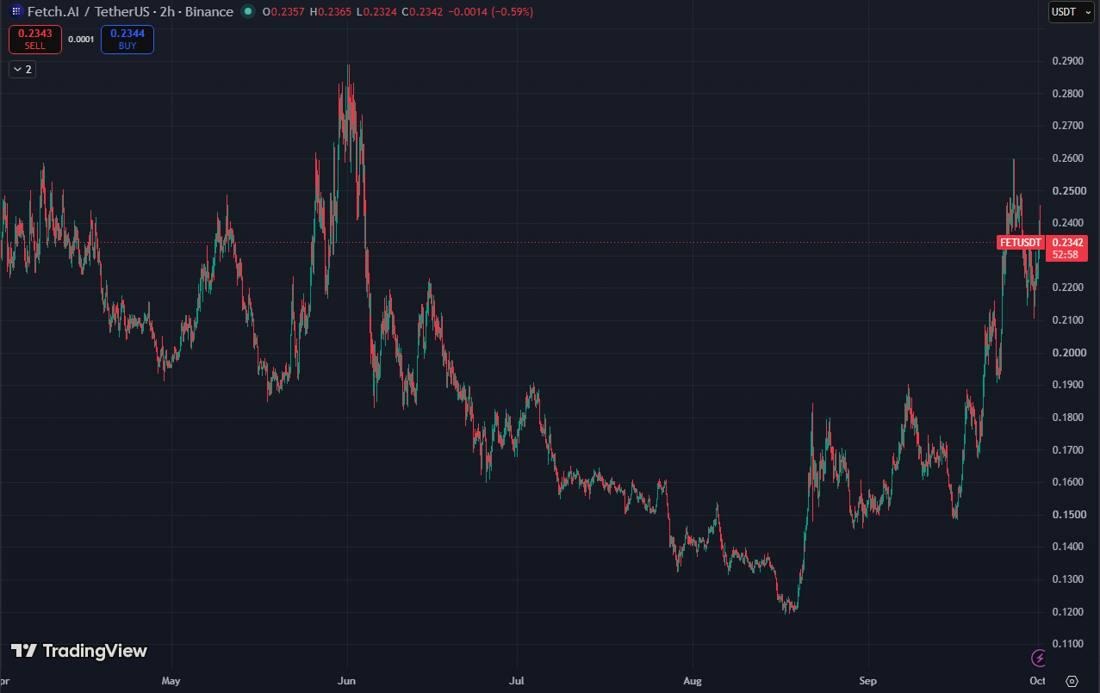
FET is trading near $0.23 after rising 51% over the month, following a $1.56 million bridge exploit and a subsequent liquidation flush. Price levels, liquidation zones and the wider AI-token backdrop are based on data available as of October 1, 2026.
The move began after a sharp decline. At 07:00 UTC on September 20, the Artificial Superintelligence Alliance said on X that an unauthorized party had withdrawn approximately $1.56 million worth of FET from a token converter. The day’s low reached $0.1671 on the Binance FET/USDT perpetual contract.
FET then reversed higher. Monday’s candle gained 16.9% from open to close, while the week beginning September 21 ended at $0.2474, representing a 41% increase. On Saturday, September 26, the token reached $0.2597. That put FET well above the $0.1671 low recorded on the day of the exploit announcement.
FET is an AI-agent token associated with a product roadmap rather than a memecoin, although its recent price movements have been similarly volatile. That makes the price action dependent on more than a single chart or isolated market reading.
FET Price Performance
FET’s advance was not a straight-line move. Wednesday, September 23, closed at $0.1941, putting the token below $0.20 again. Thursday ended at $0.2286, followed by Friday, September 25, at $0.2466. Sunday settled at $0.2474.
On Monday, September 28, FET sold off from $0.2493 to $0.2208 and closed at $0.2246. The pullback reached a low of $0.2128 on Wednesday, September 30, before the token closed at $0.2290. At 09:00 UTC on Thursday, October 1, FET was trading near $0.234.
A TradingView FET/USDT two-hour chart covering April through October 1, 2026, shows the move.
There is no verifiable evidence establishing that the exploit announcement caused the price increase; “possible” is the strongest conclusion supported by the available information. AI tokens rose more broadly during the same period. From the September 1 close through 09:00 UTC on October 1, Binance perpetual data showed FET up approximately 51%, Bittensor’s TAO up 40%, Render up 35% and Virtuals up 19%. Bitcoin gained about 8% over the same period.
FET Liquidation Zones
A liquidation heatmap identifies price areas where leveraged traders may be forcibly closed if the market reaches those levels. The zones are estimates based on exchange data and do not guarantee that price will revisit them.
On CoinGlass’s one-week liquidation heatmap for the Binance FET/USDT perpetual, the brightest bands were near $0.2335, $0.2305 and $0.2258. These levels were read from the price axis and are therefore approximate. The bands ended around Monday, September 28, when price moved through them. The chart treats a level as completed after price crosses it, suggesting that the largest clusters may have been consumed during that decline.
The remaining liquidity appeared thinner. A green band extended from approximately $0.2367 to $0.2405, or 1% to 3% above the price at the time. A stronger level appeared near $0.263, just above the September 26 high. Below the market, a moderate band ran from about $0.2105 to $0.2120, slightly below Wednesday’s $.2128 low, with weaker liquidity near $0.198.
The heatmap was recorded Thursday, October 1, 2026.
Binance Positioning Data
The positioning figures are snapshots rather than permanent conditions. Funding was 0.01% at the 08:00 UTC reading on October 1, which Binance identifies as its baseline rate. Funding was negative for two readings on September 29, at minus 0.027% and minus 0.055%.
Open interest stood at approximately $33.6 million as of 09:00 UTC on October 1, compared with a 30-day peak near $35.8 million. The taker buy/sell ratio remained below 1.0 each day from September 25 through 30, reaching a low of 0.895 on September 29. Long positions accounted for 63% of accounts on October 1, down from 70% on September 25.
Products Developed by the ASI Alliance
The Artificial Superintelligence Alliance website lists Fetch.ai, SingularityNET and CUDOS as its three members. Its products include ASI:Chain, described as the first AI-native layer-1 blockchain; ASI-1 Mini, a language model designed for agent-related work; and ASI:Cloud, a GPU and inference service. ASI:Create remained in closed beta as of June.
The latest biweekly product update, Edition 15, covered September 5 through 18. Development work on ASI:Chain included longer node tests, cross-chain messaging and delegated staking, which remained in development. ASI:Create added agent logs, a global machine pool and plugins. OmegaClaw was renamed Omega.
Token Supply and Exploit Details
According to CoinGecko, FET ranked 110th by market capitalization as of Thursday morning, with a market cap of $541 million and a fully diluted valuation of $635 million. Approximately 2.31 billion of the total 2.71 billion tokens were in circulation, or about 85%.
FET’s all-time high was $3.45 on March 28, 2024. The token remained 93% below that level. In that context, a 51% monthly gain represented a relatively small move on a chart that was still far below its record high.
The Alliance said in its X post that treasury and exchange wallets were not affected and that holders did not need to take action. The statement also said other tokens using the same infrastructure were involved, without specifying the amounts, and promised a full report after the investigation concluded. A search of the account on October 1 found no later update on the incident. Until that report is published, the combined amount withdrawn across the affected tokens remains unquantified in public statements.
Trend, Momentum and Volume
All four simple moving averages were below the FET price through Wednesday’s close. The 20-day average of closing prices was $0.1967, the 50-day average was $0.1705, the 100-day average was $0.164 and the 200-day average was $0.1916. The daily 14-period relative strength index was 62, while the weekly reading was 58, leaving both below the commonly watched 70 level.
Trading volume provided additional context. Average daily volume during the seven days through September 30 was approximately 1.8 times the 90-day average on the perpetual contract. Over those 90 days, most trading occurred between $0.133 and $0.186, with the busiest price near $0.16. Relatively little volume was recorded between $0.186 and the current price, leaving limited historical trading activity to slow a move through that area in either direction.
Measured from the June 1 high of $0.2888 to the August 17 low of $0.1191, FET was positioned between the 61.8% retracement level at $0.2240 and the 78.6% level at $0.2525. These levels describe the earlier decline and do not predict future price movements.
Price Levels Under Observation
A one-hour close above $0.2484, corresponding to equal highs on Sunday, September 27, would place $0.2597—the September 26 high—in focus, followed by the heavier liquidation band near $0.263. That scenario would no longer apply if FET produced a one-hour close below $0.2374.
A one-hour close below $0.2128, the low recorded on Wednesday, would put $0.2040, the halfway point of the June-to-August decline, in view first, followed by $0.1902, the September 8 swing high. That scenario would no longer apply if FET closed an hour above $0.2290, the October opening price.
Between those two boundaries, neither scenario was active, and that was where FET traded at the time of the report. Bitcoin was at $83,531 as of 09:00 UTC on October 1, above its 100-day average of $70,514. FET was 9.9% below its 20-day high, leaving it within its recent range rather than at a breakout level.
Bitcoin and Fund Flows
Bitcoin’s bear-market clock reached day 359 on September 30, when its price was $83,123 at 08:00 UTC. CoinShares reported $3.55 billion in weekly inflows into crypto investment products for the week ending September 29, the strongest weekly total of 2026.
The reported breakdown included $2.52 billion in Bitcoin inflows, followed by flows into Ether, Solana and XRP. AI tokens were not identified separately. Broader risk appetite may have contributed to FET’s gain, but the available information does not establish more than that possibility. Other altcoins also moved higher during the period.
The data represent price, liquidity and public project updates available as of 09:00 UTC on Thursday, October 1, 2026. Conditions can change within hours. This article is not financial or investment advice.
Source: LiveBitcoinNews

