Ethereum Reclaims $2,400 as Falling Treasury Yields Ease Inflation Pressure
Key Takeaways
- •September's US Producer Price Index rose 1.3% month-over-month and 6.3% year-over-year, surpassing forecasts of 0.5% and 5.3%, while core PPI also exceeded expectations.
- •Ethereum fell toward $2,340 after the inflation releases but recovered above $2,400 on Friday, with the decline concentrating losses among leveraged bullish traders.
- •The rebound coincided with the US 10-year Treasury yield falling to 5.095%, its lowest level since September 22, and the Dollar Index slipping to approximately 102.04.
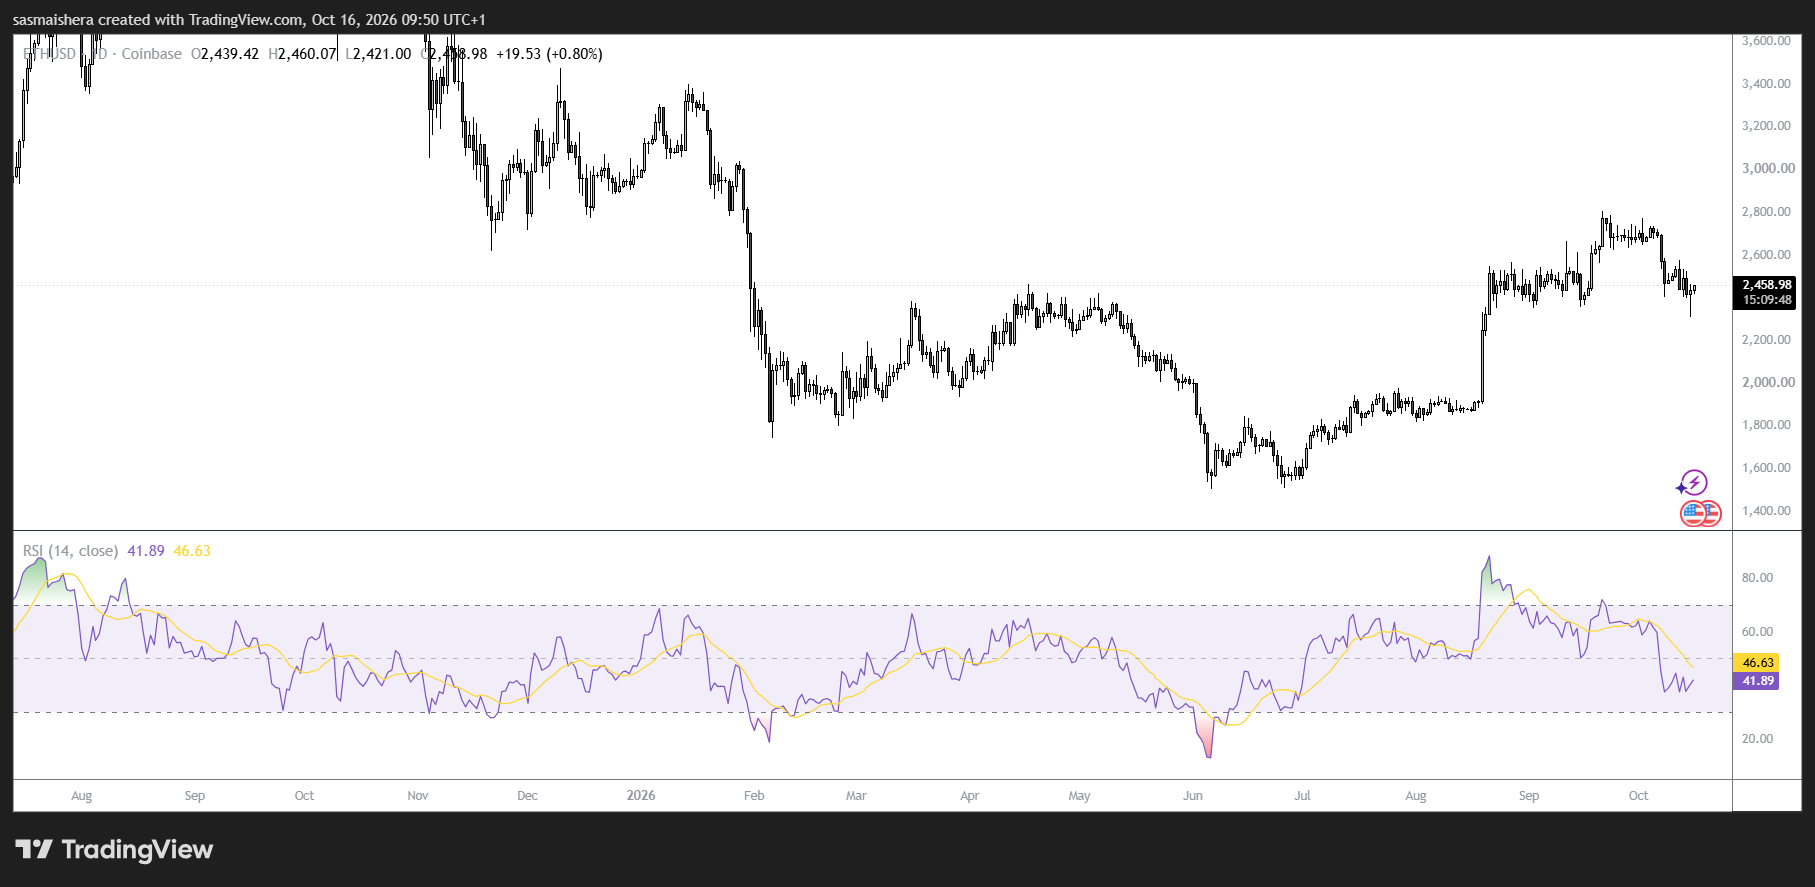
- •Ether is defending the $2,355–$2,35 support zone near its 100-day EMA, with the RSI at 40.9 indicating eased near-term bearish pressure that does not yet confirm a trend reversal.
- •A daily close below $2,355–$2,356 could expose support at $2,204, then $1,971 and $1,827, while resistance sits at the 50-day EMA near $2,496 and the $2,548–$2,552 barrier.
Ethereum climbed back above $2,400 on Friday after a stronger-than-expected US wholesale inflation report briefly dragged the cryptocurrency toward $2,340, with the recovery gathering pace as Treasury yields and the dollar retreated from post-data levels.
Hot producer inflation print rattled markets
September's Producer Price Index rose 1.3% month-over-month and 6.3% year-over-year, topping forecasts of 0.5% and 5.3%, respectively. The PPI, released Thursday, tracks prices received by domestic producers and is closely watched as an early gauge of pipeline inflation.
Core PPI, which excludes food and energy prices, also exceeded expectations, climbing 0.7% on the month and 5% annually versus forecasts of 0.3% and 4.4%.
The figures followed Wednesday's hotter-than-expected Consumer Price Index release, which measures price changes on the consumer side of the economy, adding to concerns about persistent inflation and the outlook for monetary policy. For crypto traders, that policy outlook is a recurring point of focus because digital assets trade as part of the broader pool of risk assets rather than in isolation. Ethereum initially declined alongside other risk assets before recovering as Treasury yields and the US dollar pulled back.
The sell-off concentrated losses among bullish traders, underscoring the pressure on leveraged positions during the decline. Forced position closures can intensify selling as falling prices erode traders' collateral. The figures cover the full 24-hour period, including the volatility surrounding the inflation releases, rather than only the immediate market response to Thursday's data.
Yields and dollar retreat support recovery
Ethereum's rebound coincided with a drop in the US 10-year Treasury yield to 5.095%, its lowest level since September 22. The 10-year rate acts as a benchmark for borrowing costs across the US economy, so its direction shapes how investors size up riskier holdings such as cryptocurrencies and equities. Lower borrowing-cost expectations helped ease one source of pressure on the asset following the earlier inflation-driven rise.
The US Dollar Index, which measures the greenback against a basket of major currencies, also reversed its post-CPI gains, slipping to approximately 102.04 at the time of writing. Because cryptocurrencies are quoted in dollars, the greenback's swings also alter how expensive they look to buyers holding other currencies.
Together, the retreat in yields and the dollar offered a more supportive backdrop for the broader cryptocurrency recovery, even as underlying inflation concerns remained unresolved.
Ether defends $2,355 support zone
On the daily chart, Ethereum recovered from the area around its 100-day exponential moving average at $2,356 and horizontal support at $2,355 after briefly dipping beneath that zone. Buyers are now attempting to keep the recovery intact above $2,411.
Momentum indicators have improved modestly. The Relative Strength Index edged up to 40.9, while the Stochastic Oscillator stood near 25. Both readings suggest immediate bearish pressure has eased, although neither confirms a trend reversal.
The first obstacle sits at the 50-day EMA at $2,496. Beyond it, horizontal resistance at $2548 and the 20-day EMA at $2,552 form a closely grouped barrier that could challenge the recovery. Reclaiming those levels would strengthen the short-term outlook.
On the downside, the $2,355–$2,356 area remains pivotal. A daily close below it could open the door to support at $2,204, followed by $1,971 and $1,827 should selling intensify.
With inflation data still steering rate expectations, those technical levels now sit against the same macro backdrop that pushed ether in both directions this week.
Source: CoinJournal

